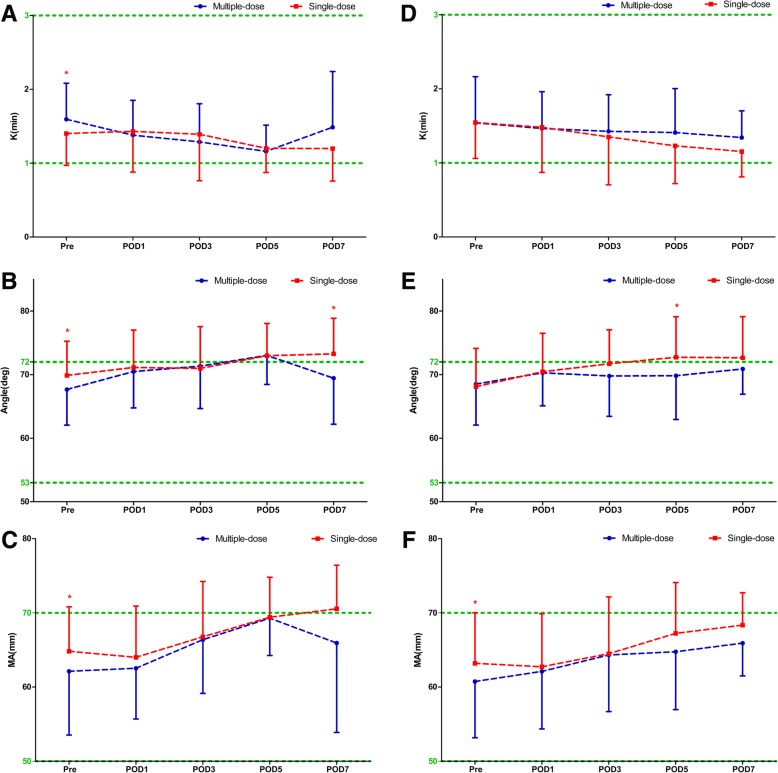
Fig. 2.
The perioperative TEG parameters (K, α-angle and MA values) of THA (a–c) and TKA (d–f). The asterisks indicate values that were significantly different between the multiple-dose and single-dose cohorts. Horizontal green dotted lines indicate the normal range (upper green line for upper limits, lower green line for lower limits). K kinetics, MA maximum amplitude, TEG thromboelastography, THA total hip arthroplasty, TKA total knee arthroplasty, Pre pre-operation, POD1 post-operative day 1, POD3 post-operative day 3, POD5 post-operative day 5, POD7 post-operative day 7

