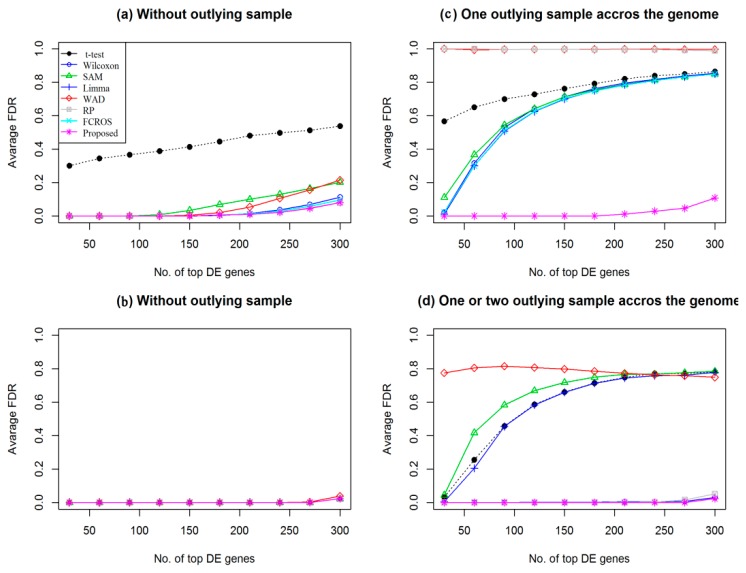
Figure 3.
Plot of average false discovery rate (FDR) versus top 300 differentially expressed genes (DEGs) estimated by different methods using data type 1. For small sample cases (n1 = n2 = 3): (a) without outlying sample and (c) one outlying sample across the genome. For large sample cases (n1 = n2 = 15): (b) without outlying sample and (d) one or two outlying samples across the genome.

