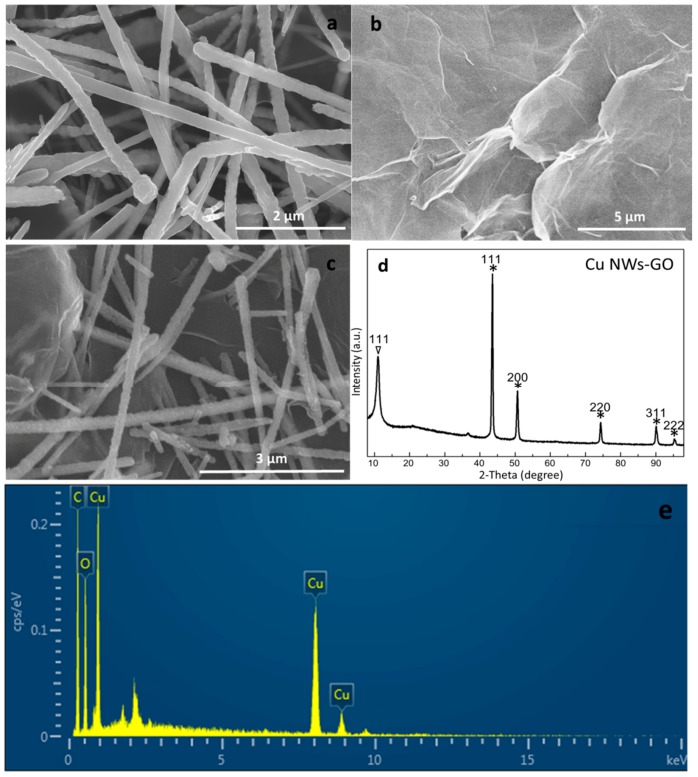
Figure 1.
The scanning electron microscope (SEM) images of (a) copper nanowires (Cu NWs), (b) graphene oxide (GO) and (c) Cu NWs–GO nanocomposite. (d) The X-ray diffraction (XRD) patterns of Cu NWs–GO nanocomposite. The asterisks represent the 2θ values of Cu NWs surface. (e) The energy-dispersive X-ray (EDS) spectrum of Cu NWs–GO nanocomposite.

