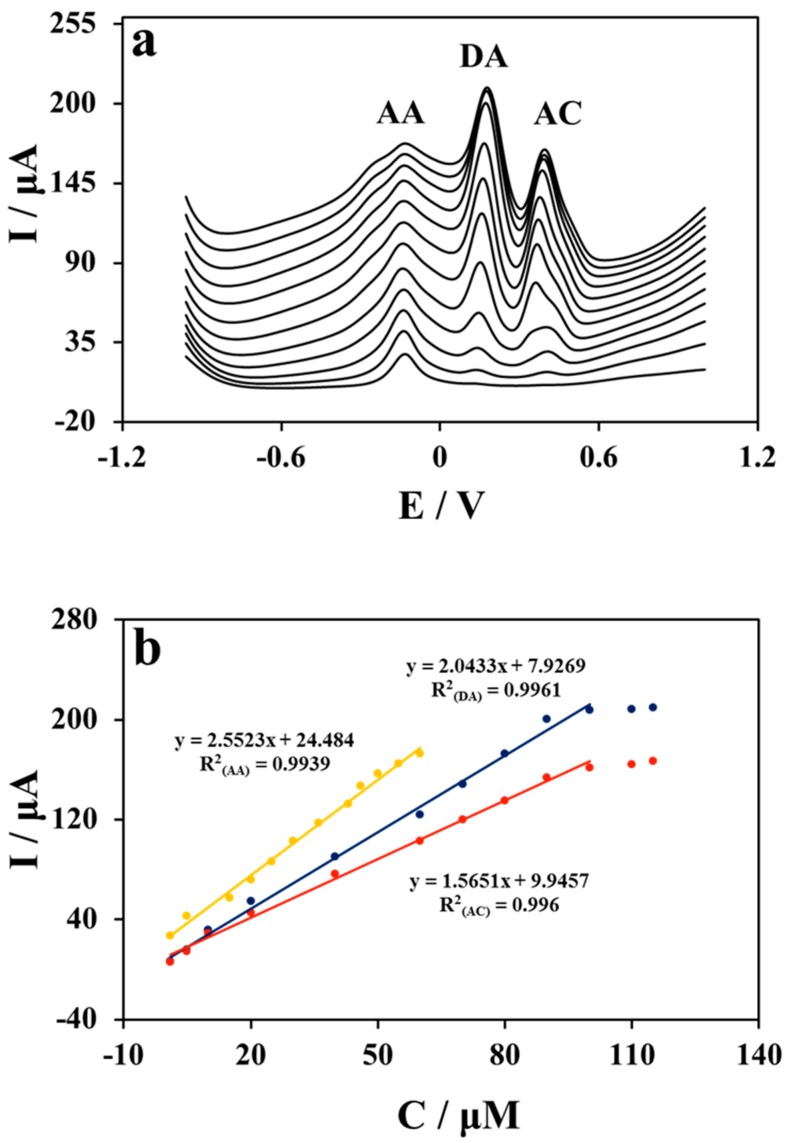
Figure 4.
(a) DPV profiles at Nafion/Cu NWs–GO/GCE in 0.1 M PBS (pH 7.0) containing different concentrations of AA, DA, and AC. From bottom to up the concentrations: 1, 5, 15, 20, 25, 30, 36, 43, 46, 50, 55, 60 μΜ for AA; 1, 5, 10, 20, 40, 60, 70, 80, 90, 100, 110, 115 μΜ for DA; 1, 5, 10, 20, 40, 60, 70, 80, 90, 100, 110, 115 μΜ for AC. (b) Plots of the oxidation peak currents of AA, DA and AC vs. concentrations.

