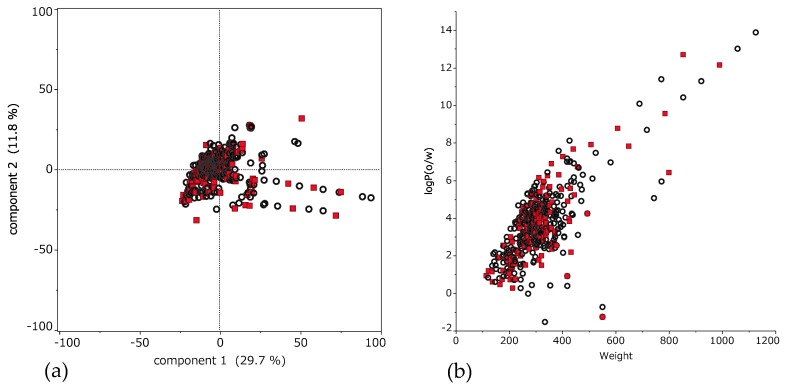
Figure 2.
Chemical space of 494 compounds. (a) Applicability domain (AD) of 494 compounds. Scatter plot of principal component analysis using descriptors. The horizontal axis is the first principal component, and the vertical axis is the second principal component. These percentage are eigenvalue that represent a partition of the total variation in the multivariate sample. Each dot represents a compound; black circle is the training set and red square is the external validation set. (b) The horizontal axis is molecular weight (MW) and the vertical axis is octanol-water partitioning coefficient (logP). Here, each dot represents a compound; black is the training set and red is the external validation set.

