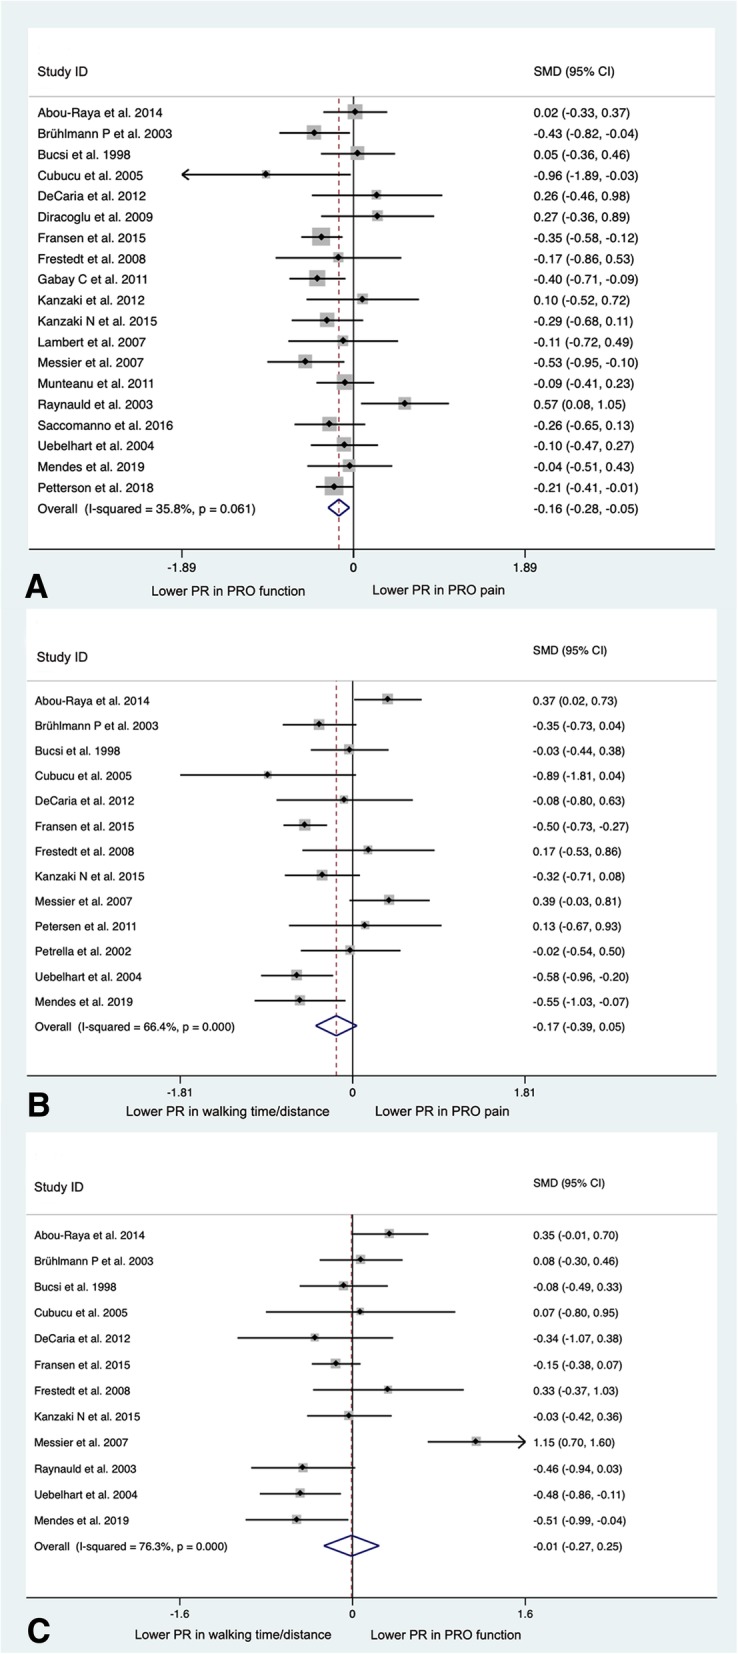
Fig. 2.

a Forest plot analysis of the comparison between PRO pain and PRO function. b Forest plot analysis of the comparison between PRO pain and walking time/distance. c Forest plot analysis of the comparison between PRO function and walking time/distance. (PRO, patient-reported outcomes; PR, placebo response; SMD, standardized mean difference; CI, confidence interval)
