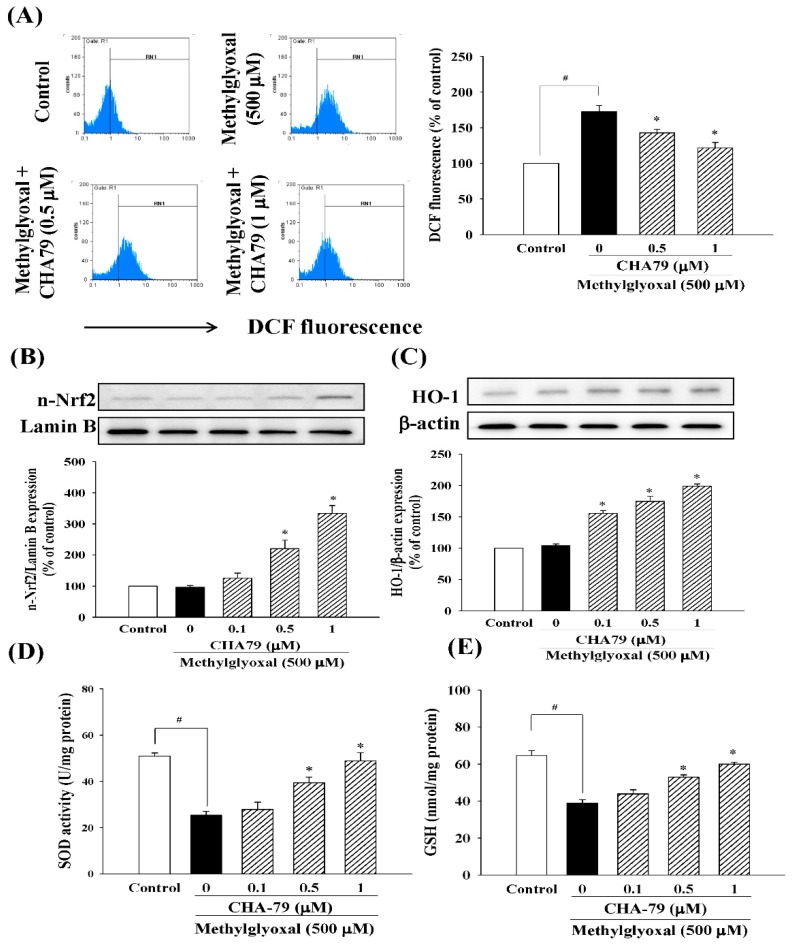
Figure 6.
CHA79 down-regulated ROS production (A), up-regulated nuclear-Nrf2 (n-Nrf2) expression (B), HO-1 expression (C), SOD activity (D), total GSH level (E) in MG-treated SH-SY5Y dopaminergic neurons. One-hour pre-treatment with CHA79 (0.1–1 μM) followed by 24 h MG (500 μM) exposure was carried out. Fluorescent DCF was measured a by flow cytometer as the indicator of ROS production. WB data are presented as % of control follow by normalization with internal standard (β-actin or Lamin B). Commercial kits were used for detecting GSH and SOD. Data are shown as mean ± SEM (n = 6). # p < 0.05 versus the control group (vehicle control: 0.1% DMSO). * p < 0.05 versus the MG group.

