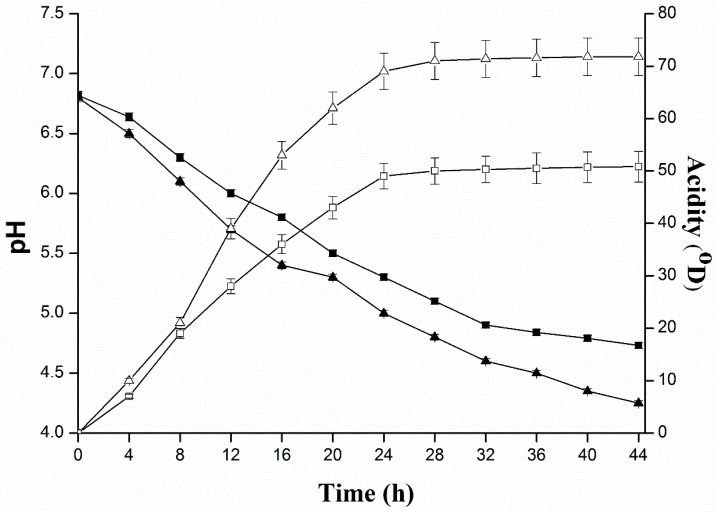
Figure 1.
Evaluation of acidity (□ with solid line) and pH (■ with solid line) in pure culture and mixed culture of L. plantarum KLDS 1.0344, as well as acidity (△ with solid line and pH (▲with solid line) in mixed cultures of L. monocytogenes ATCC 19115, S. typhimurium ATCC 14028, E. coli O157:H7 ATCC 43889, S. aureus ATCC 25923.

