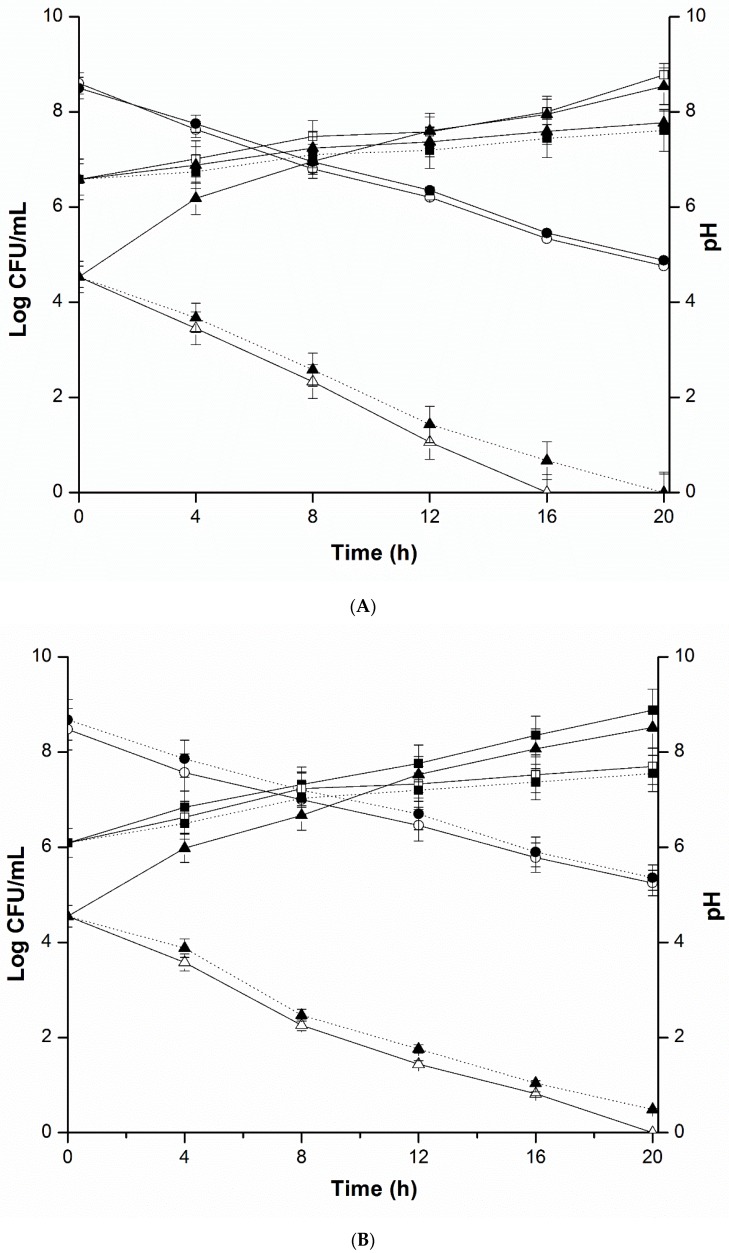
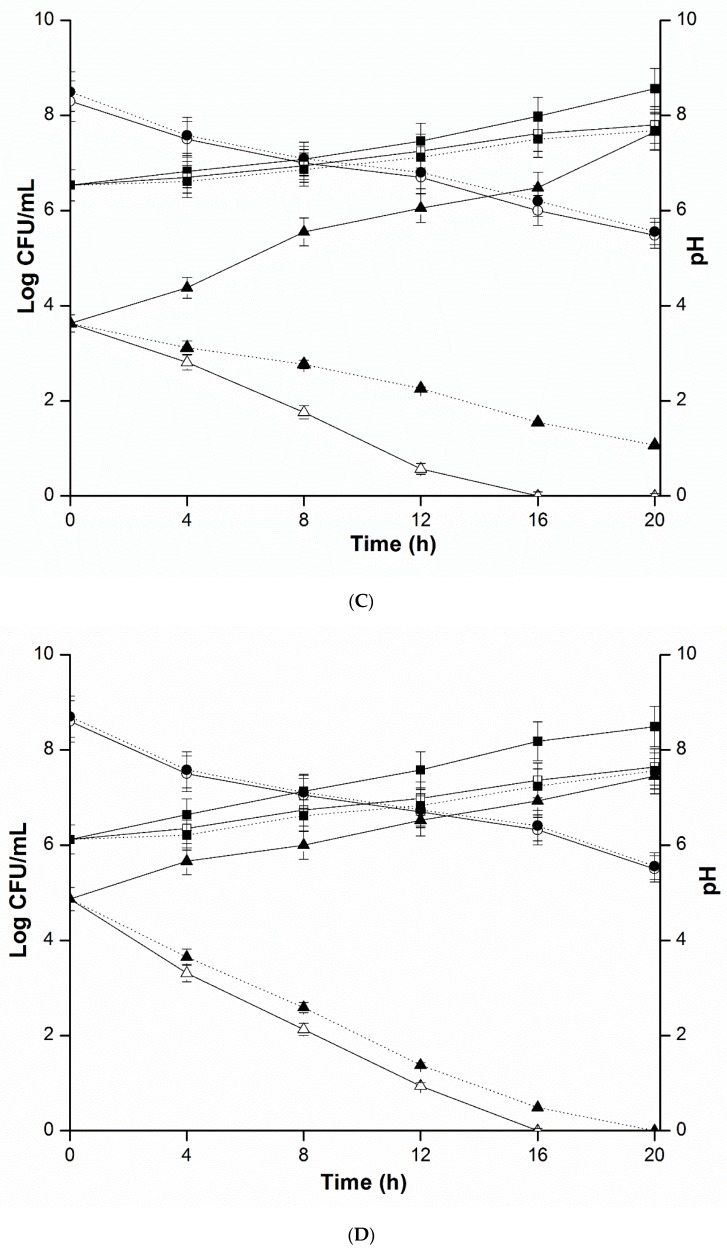
Figure 4.
(A) Progression of L. plantarum KLDS 1.0344, pathogens and shift of pH in contact co-culture experiment (▲ with flecked line, ▲with solid line and △ with solid line) represents quantity of viable pathogens containing S. aureus in monoculture group, co-cultured with L. plantarum KLDS 1.0344 and diffusion chamber groups correspondingly; (■ with flecked line, ■ with solid line, and □ with solid line) represents viable counts of co-cultured with pathogens group, L. plantarum KLDS 1.0344 in monoculture group and diffusion chamber group correspondingly; (○ with solid line and ● with flecked line) represents pH of cultures in corresponding diffusion chamber and co-culture groups. (B) Progression of L. plantarum KLDS 1.0344, pathogens and shift of pH in contact co-culture experiment (▲ with flecked line, ▲with solid line and △ with solid line) represents quantity of viable pathogens containing E. coli O157:H7 in monoculture group, co-cultured with L. plantarum KLDS 1.0344 and diffusion chamber groups correspondingly; (■ with flecked line, ■ with solid line, and □ with solid line) represents viable counts of co-cultured with pathogens group, L. plantarum KLDS 1.0344 in monoculture group and diffusion chamber group correspondingly; (○ with solid line and ● with flecked line) represents pH of cultures in corresponding diffusion chamber and co-culture groups. (C) Progression of L. plantarum KLDS 1.0344, pathogens and shift of pH in contact co-culture experiment (▲ with flecked line, ▲with solid line and △ with solid line) represents quantity of viable pathogens containing S. typhimurium in monoculture group, co-cultured with L. plantarum KLDS 1.0344 and diffusion chamber groups correspondingly; (■ with flecked line, ■ with solid line, and □ with solid line) represents viable counts of co-cultured with pathogens group, L. plantarum KLDS 1.0344 in monoculture group and diffusion chamber group correspondingly; (○ with solid line and ● with flecked line) represents pH of cultures in corresponding diffusion chamber and co-culture groups. (D) Progression of L. plantarum KLDS 1.0344, pathogens and shift of pH in contact co-culture experiment (▲ with flecked line, ▲with solid line and △ with solid line) represents quantity of viable pathogens containing L. monocytogenes in monoculture group, co-cultured with L. plantarum KLDS 1.0344 and diffusion chamber groups correspondingly; (■ with flecked line, ■ with solid line, and □ with solid line) represents viable counts of co-cultured with pathogens group, L. plantarum KLDS 1.0344 in monoculture group and diffusion chamber group correspondingly; (○ with solid line and ● with flecked line) represents pH of cultures in corresponding diffusion chamber and co-culture groups.


