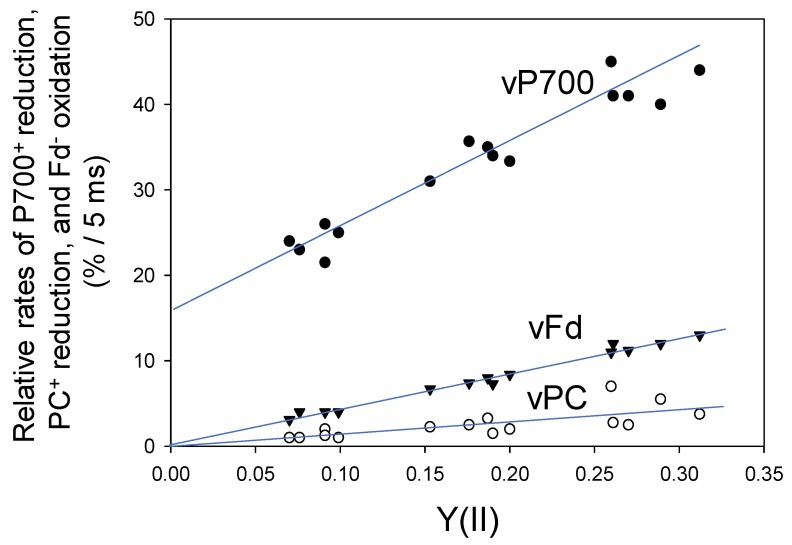
Figure 3.
Relationships of vPC, vP700 and vFd with the apparent Y(II) in wheat leaves. Data points were expressed as relative changes (%) for 5 ms as initial changes from five plants (n = 5) after turning off of the AL, as described in Figure 1. A decrease in pCO2 lowered Y(II). Open circle, vPC; closed circle, vP700; reverse triangle, vFd.

