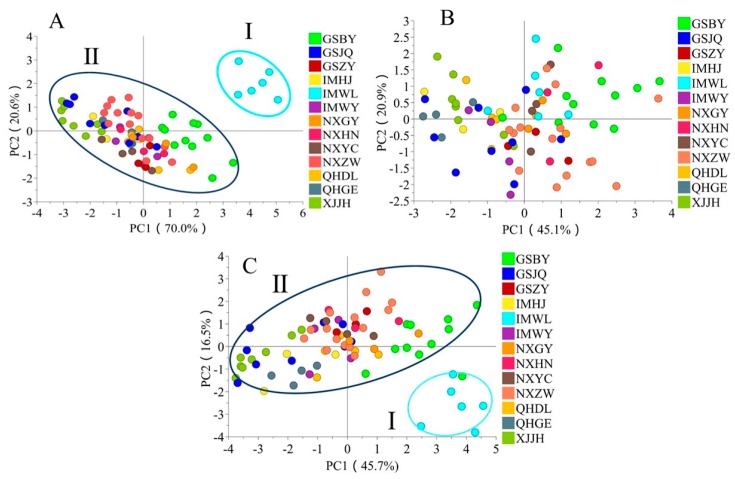
Figure 3.
PCA plots of FLB from different regions with functional components ((A) PCA plots with total and individual carotenoids; (B) PCA plots with the total phenolic, total flavonoid, rutin, ferulic acid, and total polysaccharide; (C) PCA plots with total carotenoid and individual carotenoids, total phenolic, total flavonoid, rutin, ferulic acid, and total polysaccharide).

