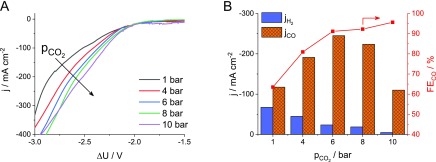
Figure 7.
(A) LSV curves recorded at ν = 10 mV s–1 sweep rate and (B) partial current densities for CO and H2 formation and the ratio of these during electrolysis at ΔU = −2.75 V, both as a function of the differential CO2 pressure for a cell underperforming at atmospheric pressure. The cathode compartment was purged with humidified CO2 at a flow rate of u = 750 ncm3 min–1.

