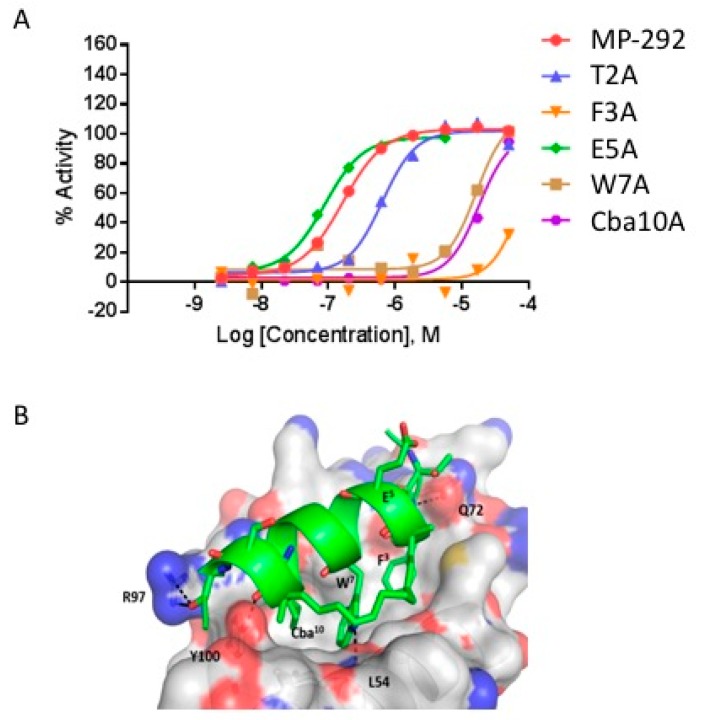
Figure 3.
(A) Select dose response curves of MP-292 analogs containing Ala substations in the p53 reporter assay. (B) Model of MP-292 in complex with Mdm2. Mdm2 is shown as surface (Grey color) and the bound peptide (Green color) is shown as a cartoon. Peptide residues, staple linker, and interacting residues from Mdm2 are shown as lines, with Mdm2/MP-292 hydrogen bond interactions shown as dashed lines (black).

