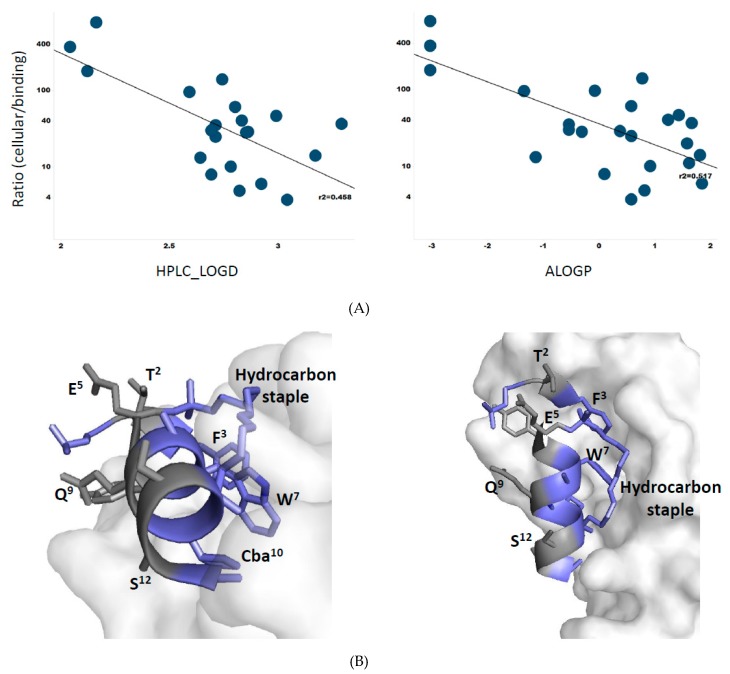
Figure 7.
(A) Correlations between cellular/biochemical ratios (see Table 1 and Table 2) and lipophilicity determinations; HPLC-LogD (Left panel) and ALogP (Right panel). (B) α-Helical structure of ATSP-7041 showing it amphipathicity in terms of hydrophobic surface in blue (F3, W7, Cba10, hydrocarbon staple) that is interacting with Mdm2, whereas the hydrophilic surface in gray (T2, E5, Q9, S12) is exposed to the solvent. The X-ray crystal structure of ATSP-7041 complexed with Mdmx (PDB code, 4N5T) was used for this analysis.

