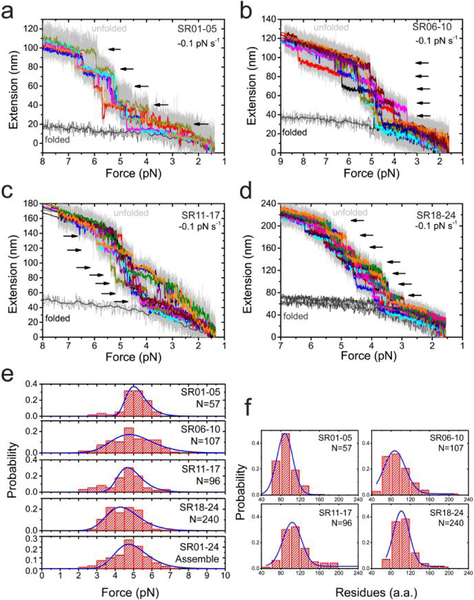
Figure 3. Force-dependent refolding of the full central rod domain.
(a-d) Typical force-extension curves of the central rod fragments (a: SR01–05, b: SR06–10, c: SR11–17, d: SR18–24) during force-decrease scan with a loading rate of −0.1 pN s−1. Each stepwise extension drop indicates a refolding event (black arrows). In each panel, multiple (>5) independent scan cycles are indicated by colors (10-points FFT smooth of raw data in gray). (e) Force distributions of the refolding of the 24 SR in the central rod domain. The blue lines are the best fitting based on Arrhenius law. (f) Distributions of the number of residues involved in each refolding events. The blue lines are Gaussian fitting of the distribution. In e&f, “N” indicates the total refolding events analyzed.

