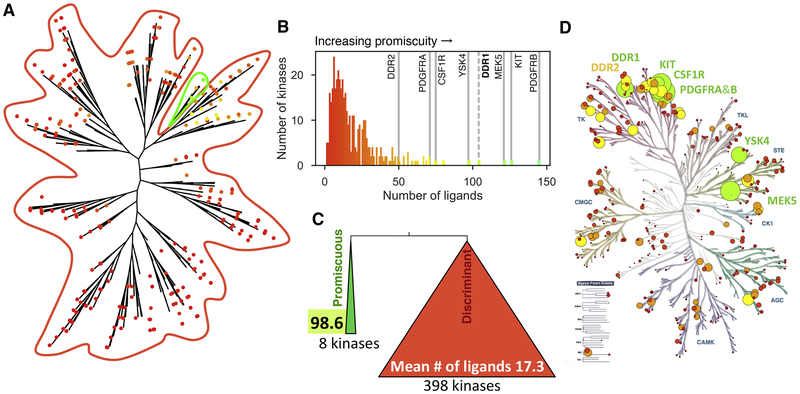
Figure 1: Hierarchical clustering of the human kinome by inhibition phenotype reveals a group of highly promiscuous kinases.
A) Hierarchical clustering analysis of the PKIS2 dataset assessing KinoBead binding inhibition for 406 kinases by 645 ligands at 1 μM concentration. Individual kinases are shown as dots and colored by the number of inhibitors capable of displacing more than 90% of kinase from covalently-tethered pan-kinase inhibitors (green being most inhibitors, red being fewest inhibitors). The promiscuous branch is circled in green. B) The most basal branch of this dendrogram is a single branch of eight promiscuous kinases that bind a mean number of 98.6 ± 31.9 ligands (green) while the other 398 in the panel bind 17.3 ± 14.0 ligands (red) (mean ± SD). C) Number of kinases that are inhibited by given number of inhibitors to more than 90%. D) Superposition of the promiscuity of kinases onto the kinase phylogenetic tree. Circle diameter is proportional to kinase promiscuity for emphasis, and colors are as in C. See also Figures S1 and S2.

