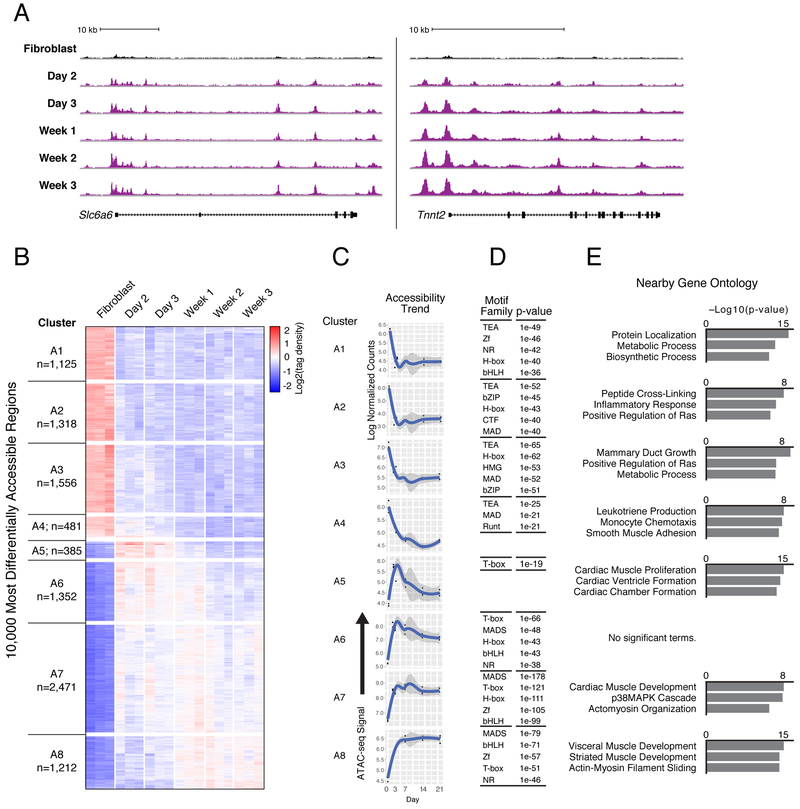
Figure 3. Cardiac Reprogramming Initiates Rapid and Distinct Patterns of Chromatin Accessibility Changes.
(A) Gain of ATAC-seq (normalized to sample read depth of condition with highest number of mapped read pairs) signal in iCMs (purple) harvested at indicated days of GMT-induced reprogramming compared to fibroblasts (black) near the early reprogramming marker gene Slc6a6 (left) and cardiomyocyte gene locus Tnnt2 (right).
(B) Hierarchical clustering of tag density over fibroblasts at 10,000 regions with most differentially accessible chromatin status in αMHC-GFP+ iCMs harvested at indicated days of reprogramming.
(C) Medoid plots representative of overall trends, showing ATAC-seq tag density over time at dynamic regions from each cluster in (B).
(D) Tables listing transcription factor families with motifs significantly enriched (p ≤ 1e-19) within dynamic regions from each cluster compared to all stably accessible (non-dynamic) regions. P-values listed are from the top ranked motif from each transcription factor family.
(E) Bar charts showing top three ranked biological process terms enriched in dynamic regions from each cluster compared to all stably accessible (non-dynamic) regions. See also Figure S3, Table S3, and Table S4.

