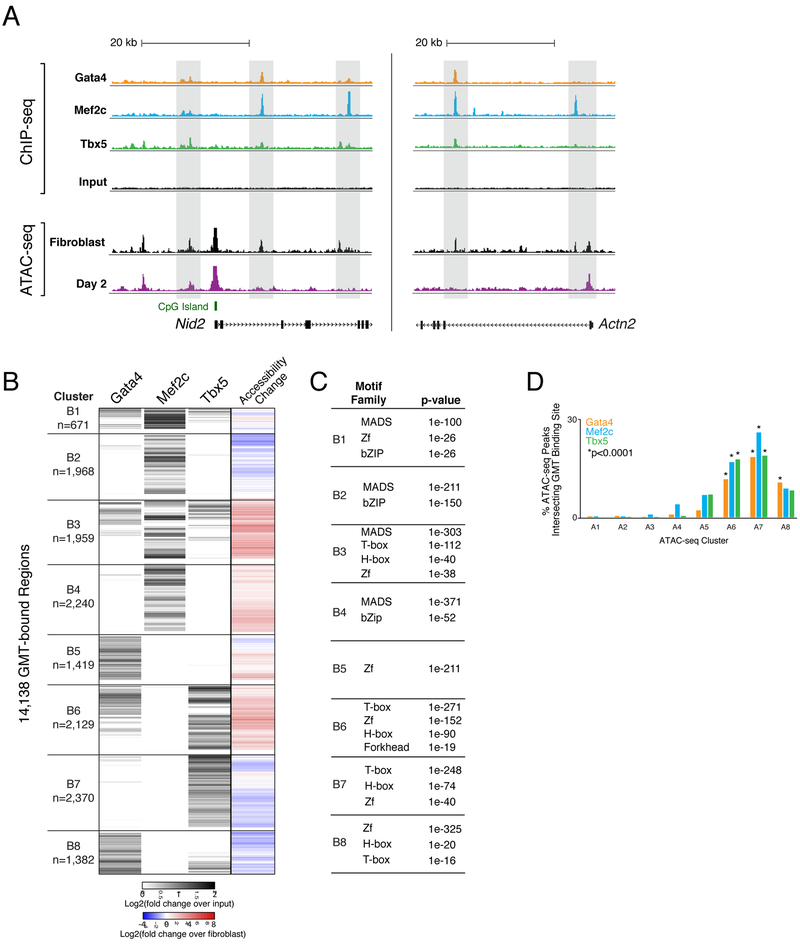
Figure 5. Chromatin Accessibility Dynamics Associated with Gata4, Mef2c, and Tbx5 Occupancy during Reprogramming.
(A) ChIP-seq profiles display GMT binding at day 2 of reprogramming near Nid2 (left panel) and Actn2 (right panel). ChIP-seq track height is normalized to sample read depth of condition with highest number of reads. ATAC-seq track height is normalized to sample read depth of condition with highest number of mapped read pairs.
(B) Heatmap displays hierarchical clustering of ChIP-seq peaks. Grey scale displays average tag density across replicates, normalized to input, with black indicating an increase in tag density in sample over input. At right, co-clustered changes in accessibility.
(C) Tables display transcription factor families with motifs significantly enriched within GMT-bound regions from each cluster, compared to stably accessible (non-dynamic) regions. P-values listed are from the top ranked motif within each transcription factor family. See also Table S6.)
(D) Bar plot displays the percentages of accessible chromatin regions (ATAC-seq peaks) from each cluster (A1-A8 in Figure 3B), bound by Gata4, Mef2c, or Tbx5. See also Figure S4 and Table S6.

