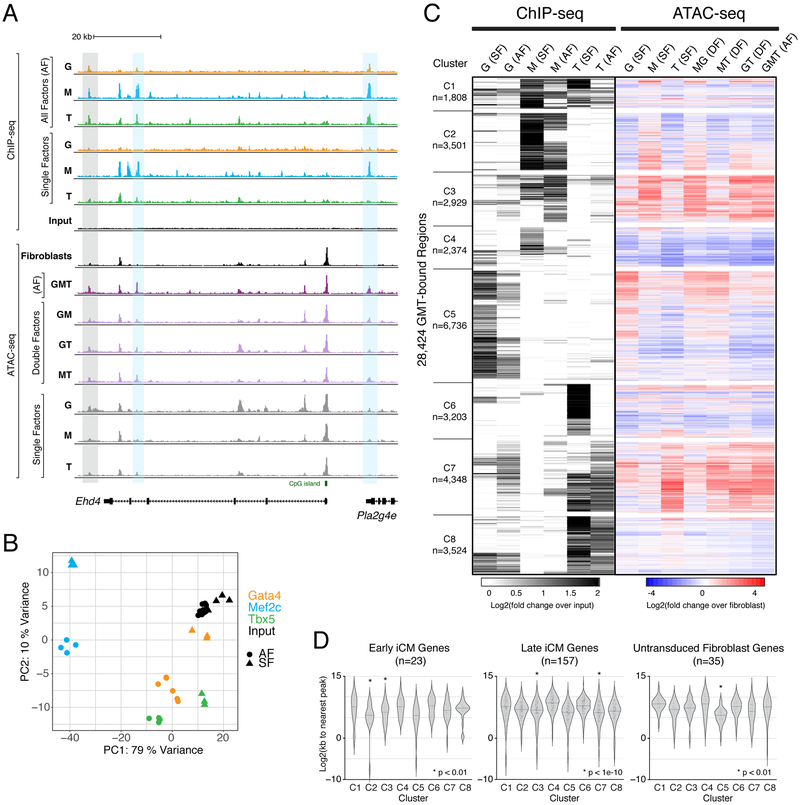
Figure 6. Chromatin Accessibility Dynamics Associated with Gata4, Mef2c, and Tbx5 Occupancy Following Independent and Combinatorial Expression.
(A) Profiles display ChIP-seq signal for GMT in single factor (SF) and all factor (AF) conditions, and ATAC-seq signal in SF, double factor (DF), and AF conditions, near the early reprogramming marker gene locus, Ehd4. Grey rectangle highlights region bound by Gata4, Mef2c, and Tbx5 in AF condition, without binding by any of these factors in SF conditions. Blue rectangles highlight regions bound primarily by Mef2c when ectopically expressed alone, but bound by Gata4, Mef2c, and Tbx5 when all factors are expressed. Profiles represent read density from merged biological replicates normalized to read depth.
(B) Principal component analysis of all ChIP-seq replicates.
(C) Heatmap displays hierarchical clustering of ChIP-seq peaks, with grey scale displaying average tag density across replicates, normalized to input (left) and color scale displaying changes in accessibility compared to fibroblasts (right).
(D) Violin plots show distribution of distances from ChIP-seq peaks in each cluster to nearest TSS of differentially expressed genes in cells from “Early iCM”, “Late iCM”, and untransduced fibroblast single cell RNA-sequencing clusters. See also Figure S5 and Table S7.

