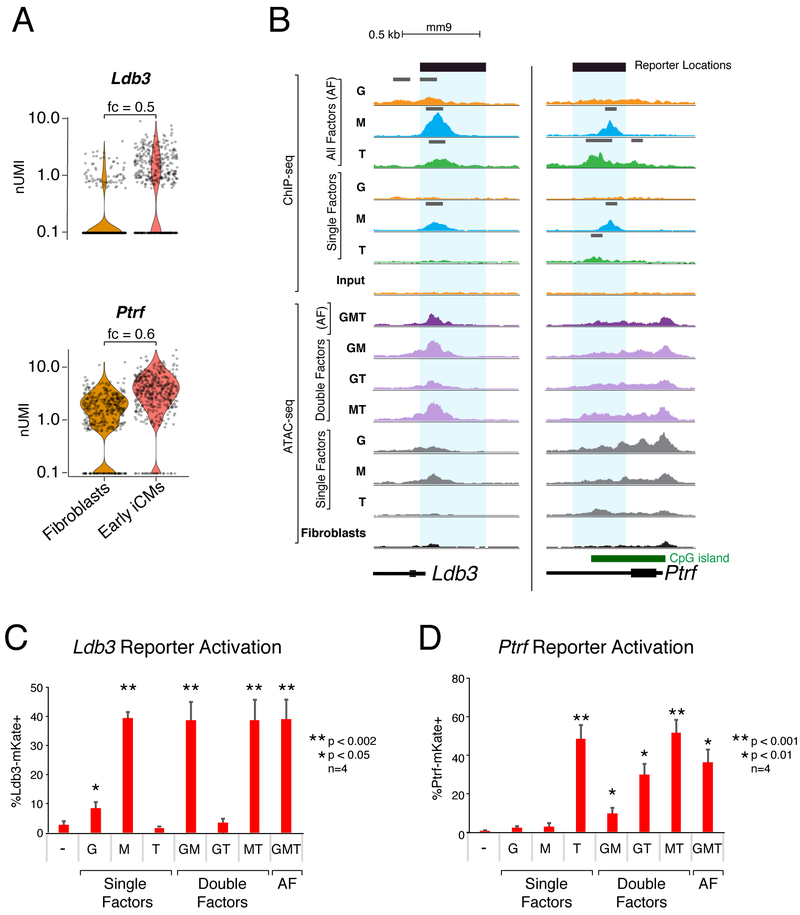
Figure 7. Individual Reprogramming Factors Activate Transcription at GMT-bound Regulatory Regions of Early Reprogramming Genes.
(A) Violin plots depicting normalized UMI levels for early iCM marker genes Ldb3 and Ptrf in fibroblasts and iCMs at day 1 of reprogramming. Fold change (fc) listed above plot.
(B) Read density profiles display ChIP-seq and ATAC-seq signal near Ldb3 and Ptrf loci in the setting of single factor (SF), double factor (DF) or all factor (AF) conditions, normalized to read depth. Peak calls indicated above ChIP-seq profiles in gray. Blue rectangles highlight putative regulatory regions investigated by reporter assays in panels (C, D).
(C) Ldb3-mKate and (D) Ptrf-mKate reporter activation at day 1 of reprogramming with single, double, and all factor (AF) infections. Values displayed are means of four replicates. Error bars indicate standard deviation. T-test uncorrected p-value thresholds as indicated.

