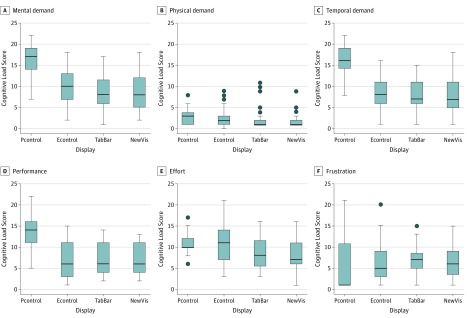
Figure 4. Cognitive Load Across 4 Display Conditions.
Participant scores of paper control (Pcontrol, 1 study, 26 participants)47 were compared with pooled scores of 3 other display conditions: electronic controls (Econtrol, 3 studies, 89 participants),16,27,32,47 tabular or bar graphs (TabBar, 3 studies, 63 participants),16,27,32 and novel visualizations (NewVis, 3 studies, 63 participants).16,27,32 The horizontal line in the box represents the median; the top and bottom borders of the box represent the upper and lower quartiles, respectively; the error bars represent the maximum and minimum values; and the circles outside the box represent outliers (beyond 1.5-fold the interquartile range above the upper quartile or below the lower quartile).

