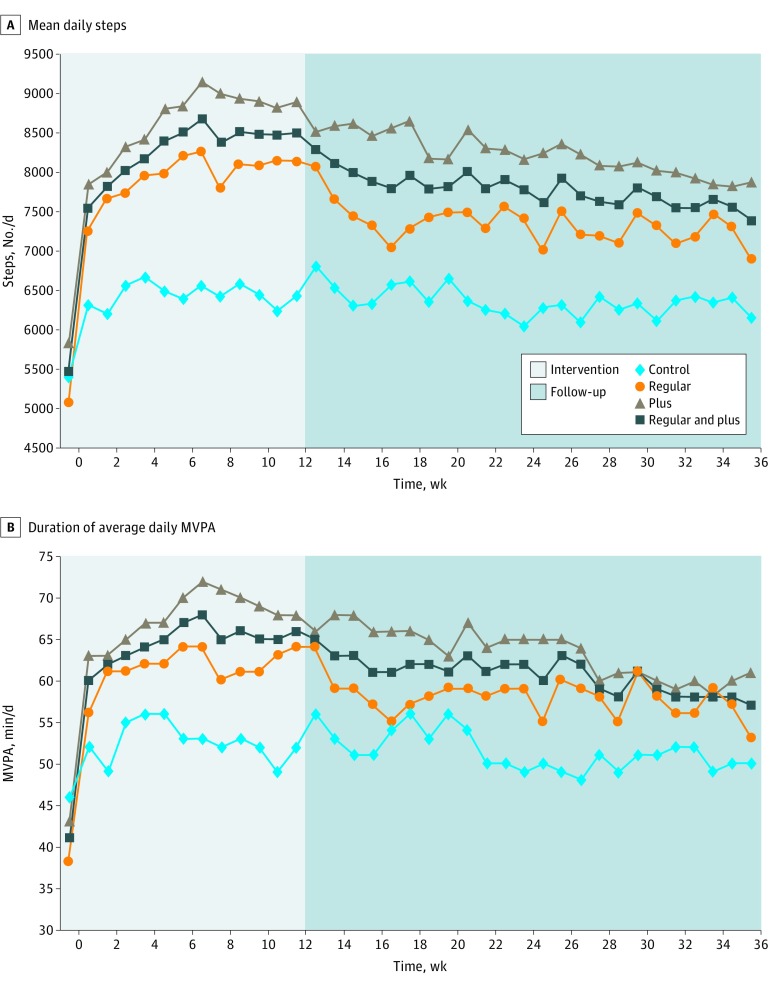
Figure 2. Changes in Mean Daily Steps and Mean Daily Moderate to Vigorous Physical Activity (MVPA) by Treatment Group and Week.
The weekly daily average is shown for participants in the control group, the regular intervention group, and the plus intervention group, as well as combined results for the 2 intervention groups.

