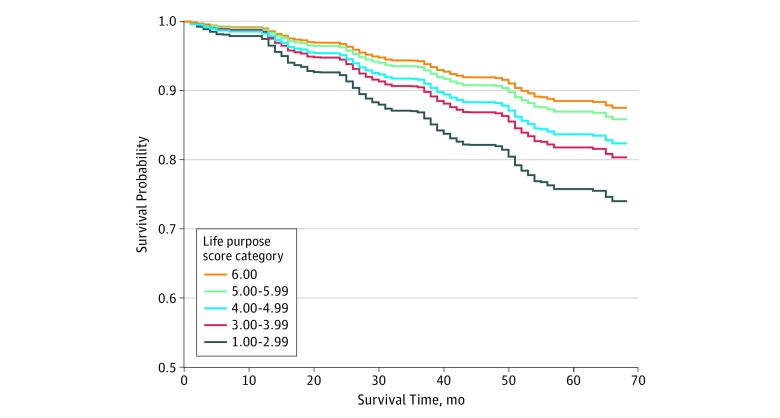
Figure. Survival Curves Illustrating the Association Between Life Purpose and Mortality.
Survival curves are adjusted for age, sex, educational level, race/ethnicity, marital status, smoking status, frequency of physical activity, alcohol consumption, body mass index, functional status, 1 or more chronic health conditions, depression, anxiety, cynical hostility, negative affect optimism, positive affect, and social participation. Adjusted survival curves are constructed by first generating a pseudopopulation based on study population characteristics. For each life purpose score category, a survival curve is estimated for this pseudopopulation based on the fitted Cox proportional hazards model presented in Table 2 assuming that all participants fall into that specific life purpose score category. This figure illustrates the relationship between life purpose and mortality on a covariate balanced pseudopopulation, with those in the lowest category (1.00-2.99) having significantly worse survival than those in the highest life purpose category (6.00).

