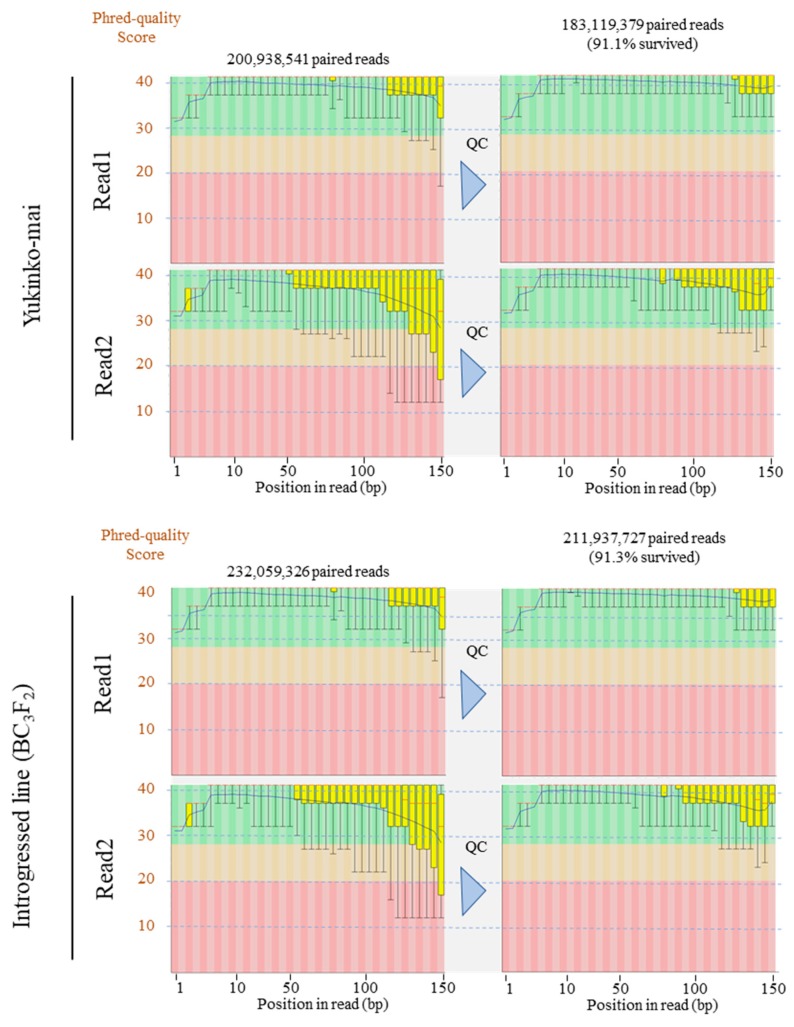
Figure 4.
Per base sequence quality of Illumina sequencing reads. Next-generation sequencing (NGS) library was constructed using the gDNA from young leaves of rice (Oryza sativa L.) plant extracted via optimized NP protocol. Phred quality scores across paired-end reads before (left columns) and after (right columns) QC are shown in box plots. The blue and red lines represent the mean quality and median value, respectively. The yellow box represents the first quartile and third quartile. The whiskers extend from the ends of the box to the top 10% and 90% values. The background of the graph in the y-axis shows sequence quality. Green, very good quality calls; orange, reasonable quality; red, poor quality. Quality control was performed using Trimmomatic v. 0.33 software [20] with the following parameters: SLIDINGWINDOW: 8:20; TRAILING: 30; MINLEN: 70.

