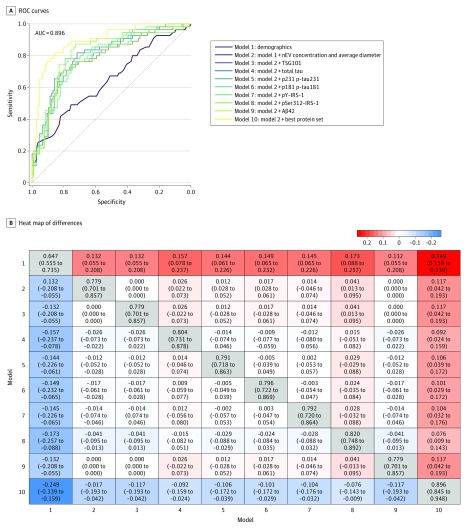
Figure 3. Alzheimer Disease Risk Prediction Models for Training Data.
Receiver operating characteristic (ROC) curves for 10 models based on training data (A). In model 1, demographics include age, sex, and plasma/serum sample type. In model 10, best protein set includes measures of TSG101, total tau, pY-IRS-1, pSer312-IRS-1, p-tau181, and β-amyloid 42 (Aβ42). Heat map of differences in area under the curve (AUC) between models with 95% CIs based on training data (B). Off diagonal elements show column model minus row model, and diagonal elements show model AUC with 95% CIs. IRS-1 indicates insulin receptor substrate 1; nEV, neuronal-enriched extracellular vesicle; p-tau; phosphorylated tau.

