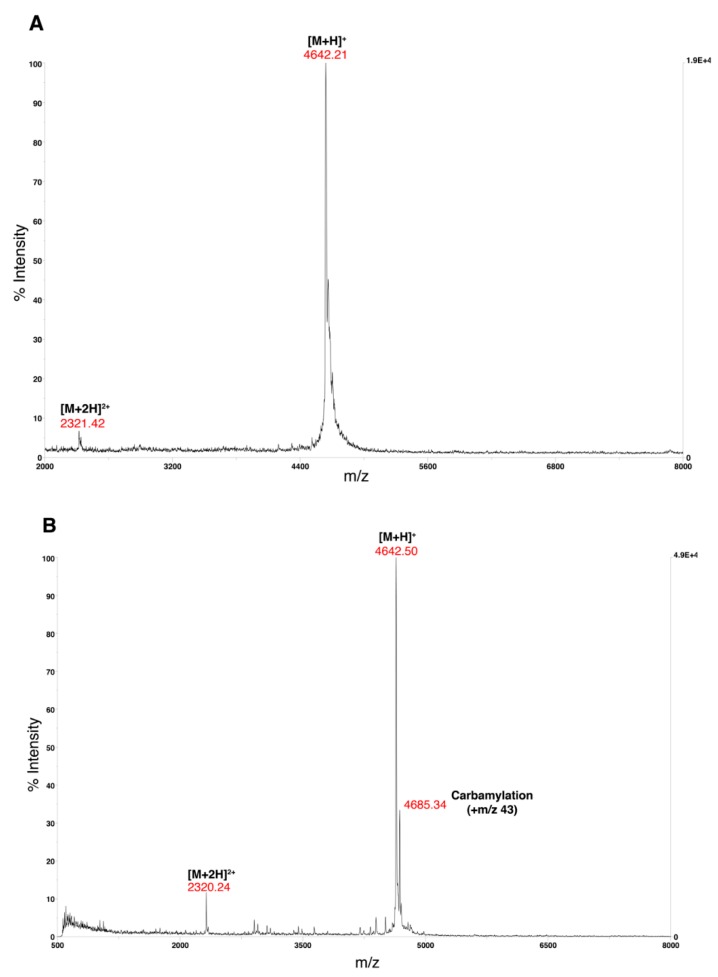
Figure 5.
MALDI-TOF mass spectra of Aβ(M1-42). A. The MALDI-TOF mass spectra of lyophilized Aβ(M1-42) in the range of m/z 2000 to 8000. The Aβ(M1-42) corresponds to the m/z 4642.21 peak. B. MALDI-TOF mass spectra of lyophilized carbamylated Aβ(M1-42) in the range of m/z 500 to 8000. Carbamylation peak (m/z 4685.34) appears ~ m/z 43 higher than the Aβ(M1-42) at m/z 4642.50 due to the extended exposure of the peptide to urea. A Voyager De-Pro MALDI-TOF mass spectrometer in positive linear mode was used with CHCA solution as the matrix for each spectrum.

