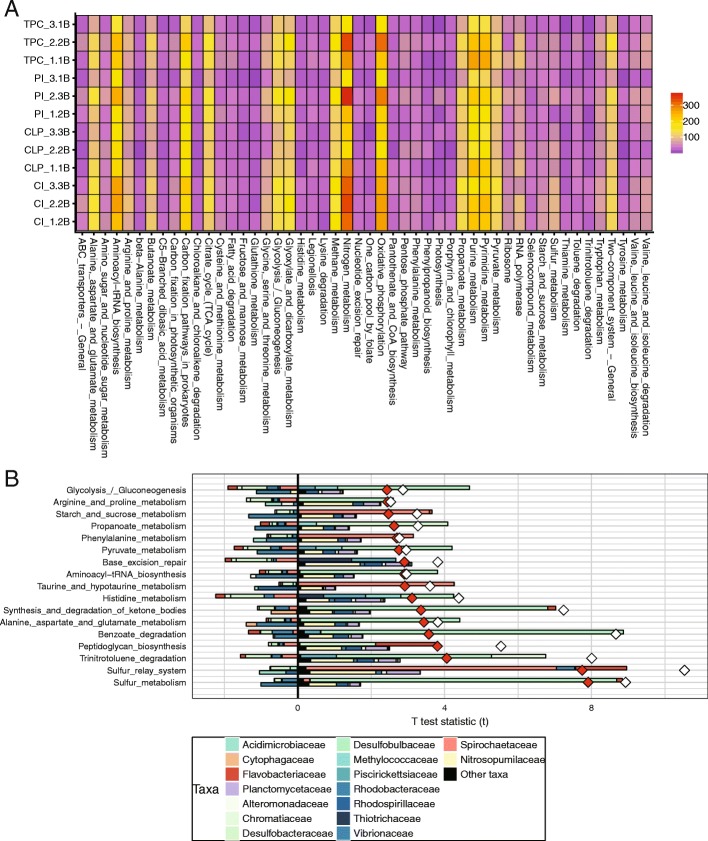
Fig. 4.
KEGG Orthology annotation and taxonomic drivers of functional shifts between sites. a Heat map of the top 50 abundant KEGG pathway annotations. b Taxon-level shift contribution profiles for significantly different KO pathways between Centre Island (case group) and Tung Ping Chau (control group) based on the top 25 abundant families. Taxonomic contributors to functional pathways differences between Centre Island (case group) and Tung Ping Chau (control group) based on the top 25 abundant families. The white and red diamonds refer to the taxa-based and functional-based shift scores, respectively

