Fig. 6.
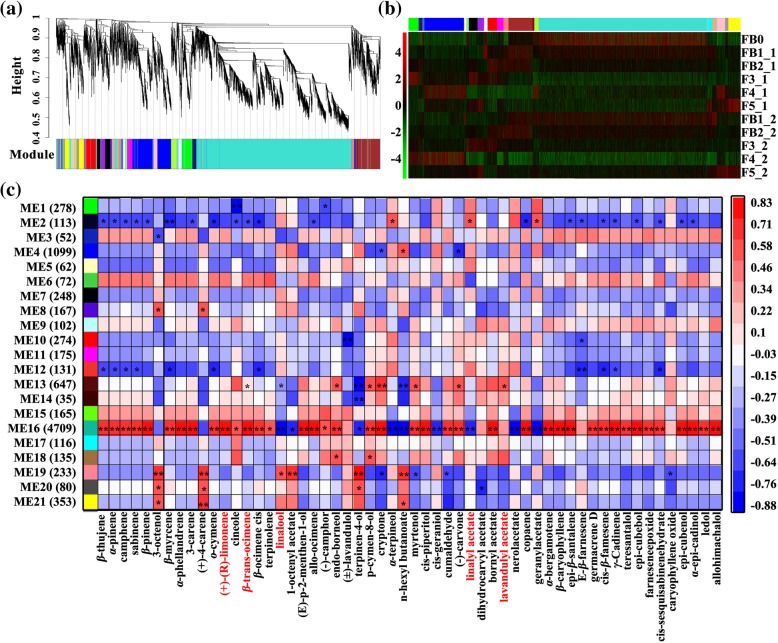
WGCNA of 9246 DEGs at different developmental stages of lavender flower. a Hierarchical cluster tree showing 22 modules of co-expressed genes. Each of the 9246 DEGs is represented by a leaf of the tree and major tree branches constitute 22 modules, labeled with different colors at the lower panel. Note that module ‘Grey’ is for unassigned genes. b Expression heatmap of genes clustered in 21 modules (exclude module ‘Grey’). c The correlations between 56 volatile terpenoids and modules. Each row represents a module and each column represents a terpenoid. The color of each block at the row–column intersection indicates the correlation coefficient: red for high positive correlation and blue for high negative correlation, with a scale shown on the right of the panel. The number of DEGs involved in each module is presented in parentheses in the left panel. Asterisks indicate significant correlations (*P < 0.05, **P < 0.01)

