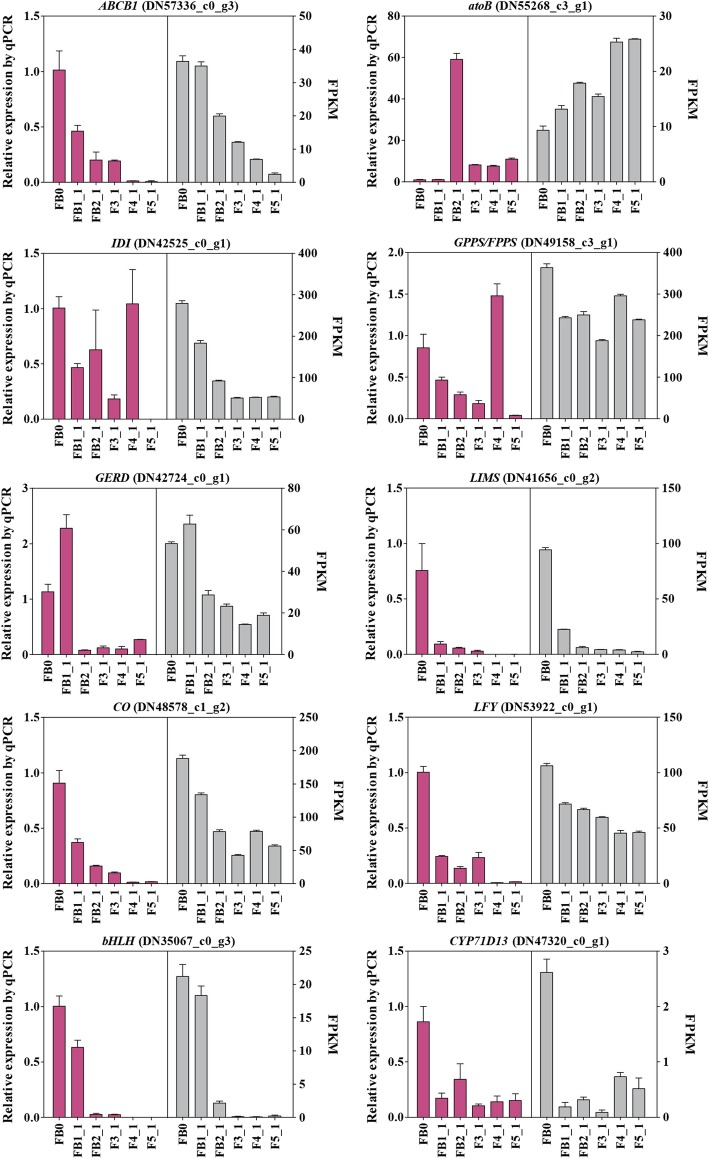
Fig. 9.
Expression patterns of eight genes as verified by qRT-PCR. Purple bars represent the relative expression levels of FB0 and first-axis flowers of five developmental stages, normalized to that of actin and 18S rRNA transcripts. Grey bars indicate FPKM values from RNA-Seq. Values shown are mean ± SE of three replicates

