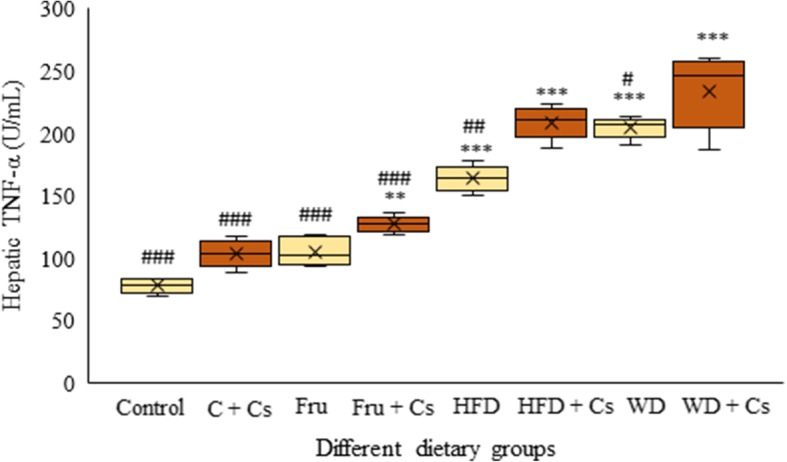
Fig. 3.

The comparative effects of different diets on hepatic inflammatory cytokine level, TNF-α after 8 weeks. Data are depicted using box and whisker plots showing median, minimum and maximum values, n = 8 in each group. *P < 0.05 and ***P < 0.001 significant difference compared to mice fed standard diet as control. #P < 0.05 and ###P < 0.001significant difference compared to smoker mice fed WD. C: control; Cs: Cigarette smoke; Fru: fructose; HFD: high fat diet; WD: western diet; TNF-α: tumor necrosis factor- α
