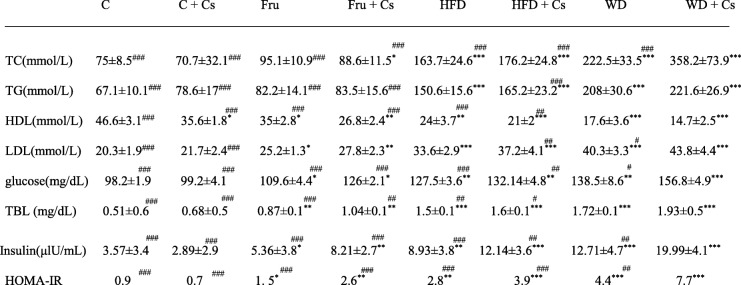
Table 1.
The comparative effects of different diets on metabolic parameters after 8 weeks
Data are expressed as means ± SD, n = 8 in each group. *P < 0.05, **P < 0.01, and ***P < 0.001 significant difference compared to mice fed standard diet as control. #P < 0.05, ##P < 0.01, and ###P < 0.001 significant difference compared to smoker mice fed WD

