Figure 5.
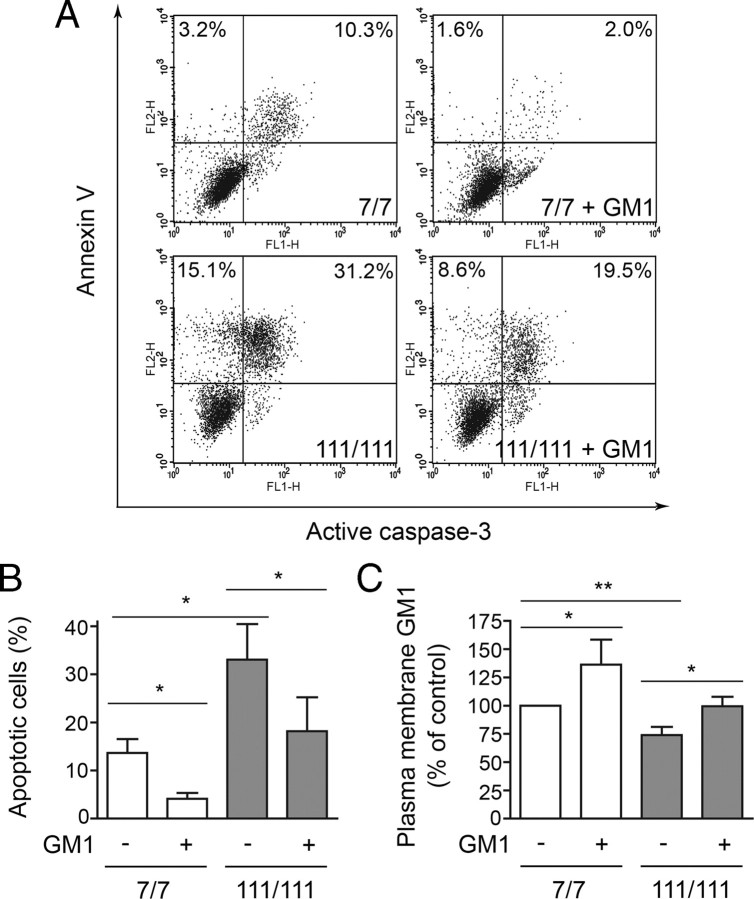
GM1 administration raises plasma membrane ganglioside levels and protects cells from apoptosis. Cells were incubated with or without 50 μm GM1 and exposed to apoptotic conditions (serum deprivation at 39°C). A, Representative FACS profile of cells after 12 h incubation in apoptotic conditions. Cells were labeled with Annexin V and then stained for active caspase-3. FL1-H and FL2-H indicate fluorescence intensity for active caspase-3 and annexin V staining, respectively. Double-positive cells in the upper right quadrant are apoptotic cells. Annexin V-positive cells, but active caspase 3-negative cells (upper left quadrant) are early apoptotic cells. The number reported in each quadrant represents the percentage of cells in the quadrant. B, Quantitation of apoptotic cells by FACS analysis of annexin V binding. Data are the mean ± SD of four experiments, each performed in triplicate. C, Plasma membrane GM1 levels were measured after GM1 administration by analysis of cholera toxin B binding. Data are expressed as the percentage of control (wild type in basal conditions) and represent the mean ± SD of three experiments, each performed in triplicate. 7/7, STHdh7/7; 111/111, STHdh111/111; *p < 0.05; **p < 0.001.

