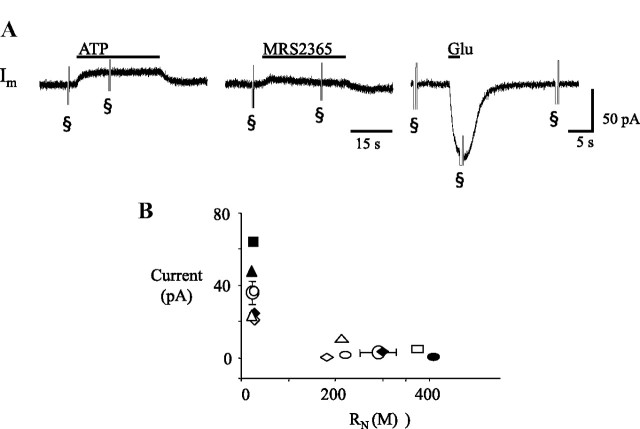
Figure 5.
Whole-cell voltage-clamp recordings from glia in the preBötC. A, Membrane current responses of a single glial cell to local application of ATP (0.1 mm, 30 s, left), a P2Y1R agonist (0.1 mm MRS 2365, 30 s, middle), and glutamate (1 mm, 2 s, right). B, Group data (n = 8) showing the relationship between maximum agonist-evoked current and input resistance (RN); each symbol type represents a different cell; open symbols represent ATP responses; closed symbols represent responses to MRS 2365 in the same cell; circles represent averaged data. § indicates current response to a voltage ramp.

