Figure 6.
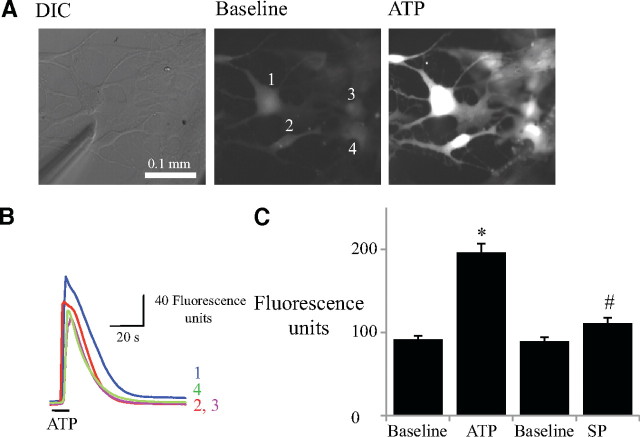
Glia cultured from the ventrolateral medulla respond to locally applied ATP (0.01 mm, 10 s) with an increase in fluo-4 Ca2+ fluorescence. A, DIC image of cultured glia and the position of the drug pipette (left panel). Epifluorescence image of cells in left panel showing baseline fluorescence (middle panel) after incubation with fluo-4 AM (10 μm) and during local application of ATP (right panel). B, Traces showing the time course of changes in intracellular Ca2+ measured in 4 ROIs (numbered 1–4) in A. C, Group data (n = 98) showing a significant increase in fluorescence in response to ATP, but not SP. *p < 0.001, significant difference from baseline; #p < 0.001, significant difference from ATP response.

