Figure 7.
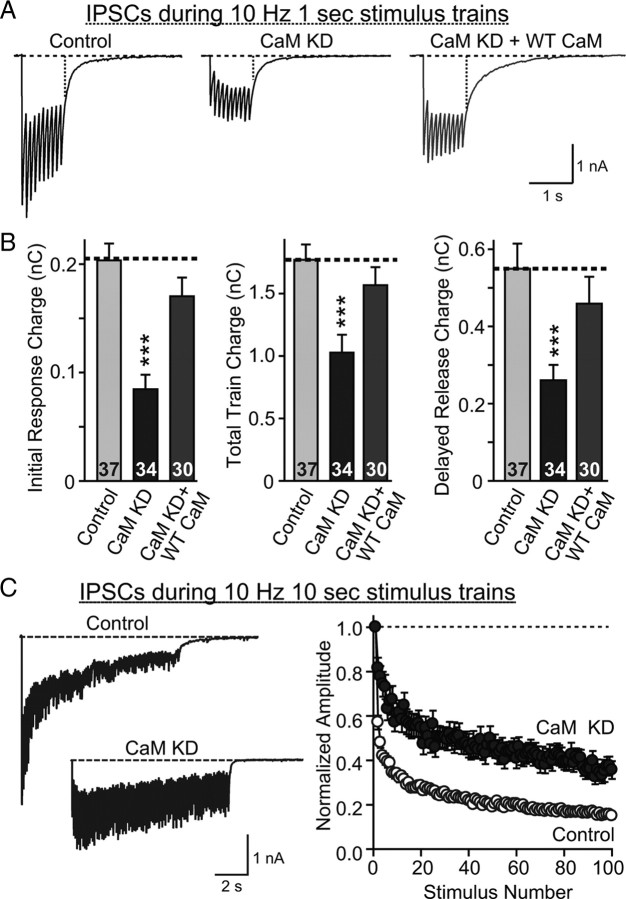
Effect of CaM KD on synaptic transmission during 10 Hz stimulus trains. A, Representative traces of synaptic responses induced by a 10 Hz, 1 s stimulus train in neurons infected with lentiviruses that express only EGFP (Control), coexpress EGFP with the CaM KD shRNAs (CaM KD), or with CaM shRNAs and wild-type CaM (CaM KD + WT CaM). B, Quantitation of the effect of CaM KDs on the synaptic charge transfer during the initial response of the 10 Hz stimulus train (left), total train (middle), and delayed release (right). C, Representative traces of IPSCs during 10 s, 10 Hz stimulus trains (left) and normalized responses to quantify the degree of depression (right). Note that only the synchronous component of the responses is included in the normalization, which increases the apparent degree of depression. Data are means ± SEMs; numbers in bars in B indicate number of cells analyzed in at least three independent experiments. Statistical significance was calculated by Student's t test, ***p < 0.001. Numbers of recordings presented in C are 27 and 30 for control and CaM KD, respectively. Curves in C are significantly different (p < 0.0001) using two-way ANOVA.

