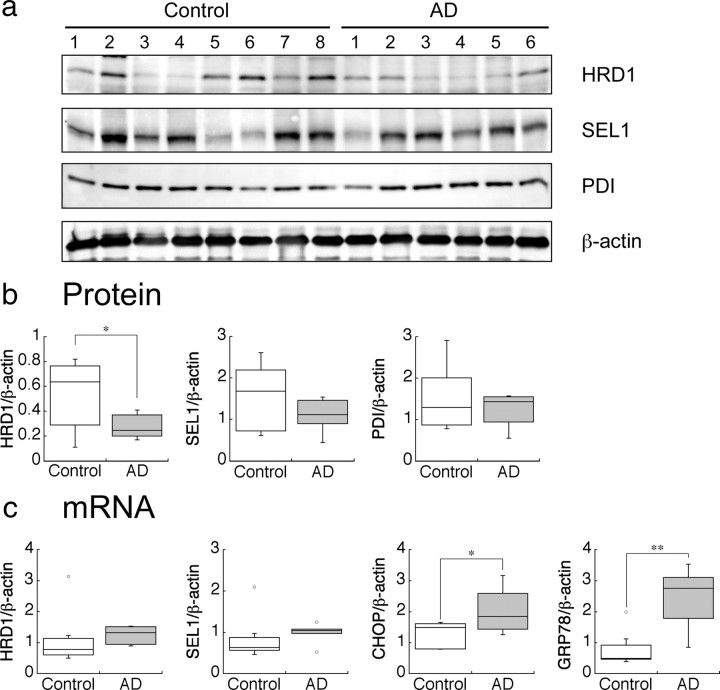
Figure 1.
Protein and mRNA levels of HRD1 in the AD brain. a, Protein levels of HRD1, SEL1, PDI, and β-actin in the AD brains. The cerebral cortex of AD patients and non-AD controls were subjected to Western blotting. b, Statistical analysis of a. Data are normalized to the amount of β-actin; results are expressed as a box plot (control, n = 8; AD, n = 6). Asterisk represents a significant difference (Student's t test, *p < 0.05). c, mRNA levels of HRD1and ER stress-responsive genes in the AD brain. The mRNA expression levels in the brains were quantified by real-time PCR. Data are normalized to the amount of β-actin. Results are expressed as a box plot (Student's t test; *p < 0.05, **p < 0.01).

