Figure 5.
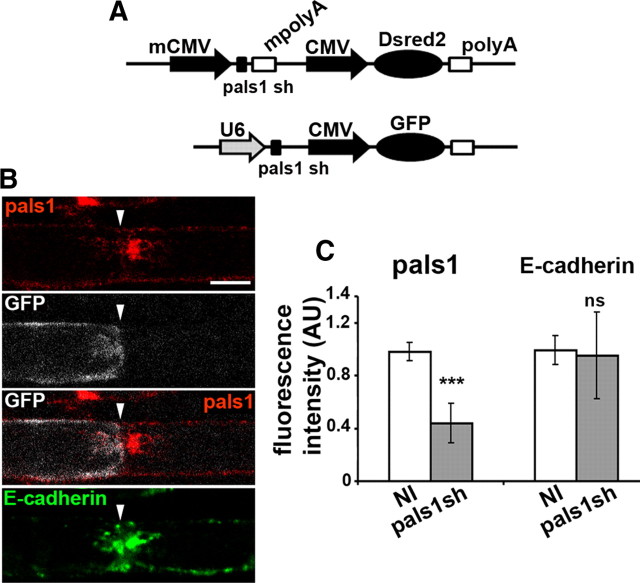
Lentivirus expressing pals1 shRNA silences pals1 expression efficiently in mSCs in vivo. A, Schematic structure of the two expression cassettes used to express pals1 shRNA with a pSICOR lentiviral vector backbone. mCMV, Minimal CMV promoter; mpolyA, minimum polyA; U6, U6 promoter. B, At a node of Ranvier (arrowhead), a cell infected with pals1 shRNA virus expresses GFP (white) and shows a strongly reduced expression of pals1 (red) in the inner part of paranodal loops (see also Fig. 1I for control). E-cadherin expression is not changed (green). Scale bar, 10 μm. C, Fluorescence intensity for pals1 is reduced in cells infected with pals1 shRNA virus (pals1 sh) versus surrounding noninfected cells (NI) (±SEM). E-cadherin fluorescence intensity is not significantly changed (ns). Number of cells counted: Pals1, 15; E-cadherin, 16. p values = 1.3 × 10⁻¹⁰ (pals1), 0.6 (E-cadherin). AU, Arbitrary unit.

