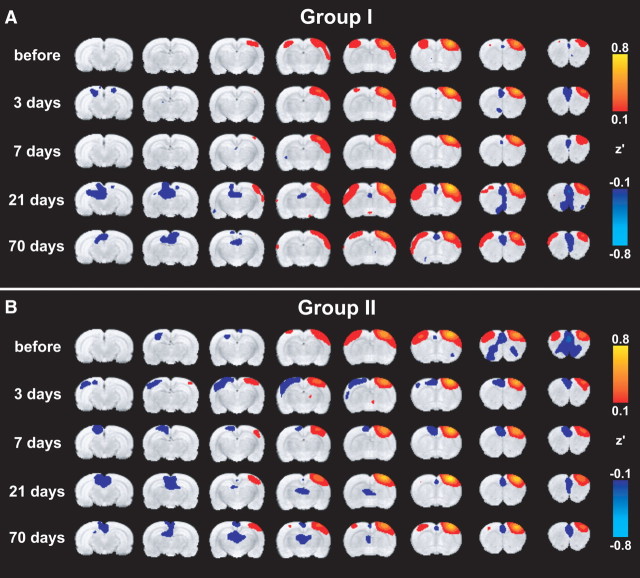
Figure 3.
Functional connectivity with right S1fl. A, B, Mean functional connectivity maps of groups I (A) and II (B), calculated from a seed in the structurally intact right, ipsilesional S1fl before and at different time points after tMCA-O. Maps display Fisher-transformed correlation coefficients (z′) ranging from 0.1 to 0.8 and −0.1 to −0.8 for positive and negative correlations, respectively, overlaid on consecutive coronal rat brain slices from a T2-weighted template.

