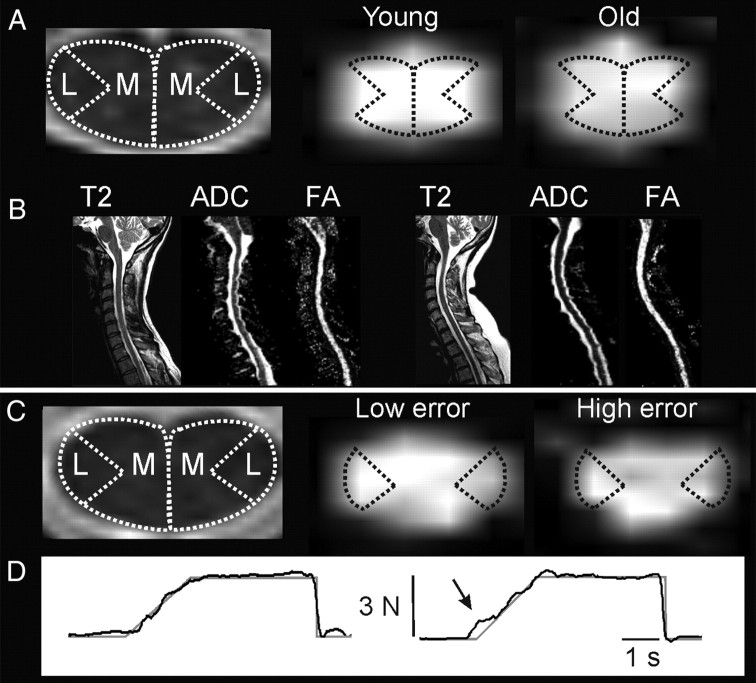
Figure 1.
Cervical spinal cord white matter in relation to age and force control. A, Left, Medial (M) and lateral (L) example ROIs on axial T2-weighted MR image at C3 level. Right, Example of axial FA maps at C3 in a young (22 years) and old (64 years) subject. Although FA differences between subjects are often difficult to detect visually (Beaulieu, 2009), slightly reduced FA can be visualized in medial spinal cord in the older subject. B, Left to right, Sagittal T2-weighted image, ADC map, and FA map in the young and old subject (same subjects as in A, left and right, respectively). The older subject did not have any signs of stenosis of the spinal cord. C, Left, Example ROIs at the C6 level. Right, Example of axial FA maps at C6 in one subject with low (64 years) and one subject with high (51 years) force-tracking error. Tendency for reduced FA can be visualized in lateral spinal cord in the subject with high tracking error. D, Single-trial force-tracking examples: target trace is shown in gray and actual force in black. Arrow indicates region of increased error during the ramp to the 3 N target force level in the subject with higher mean error across trials (same subjects as in C, left and right, respectively).

