
Figure 6.
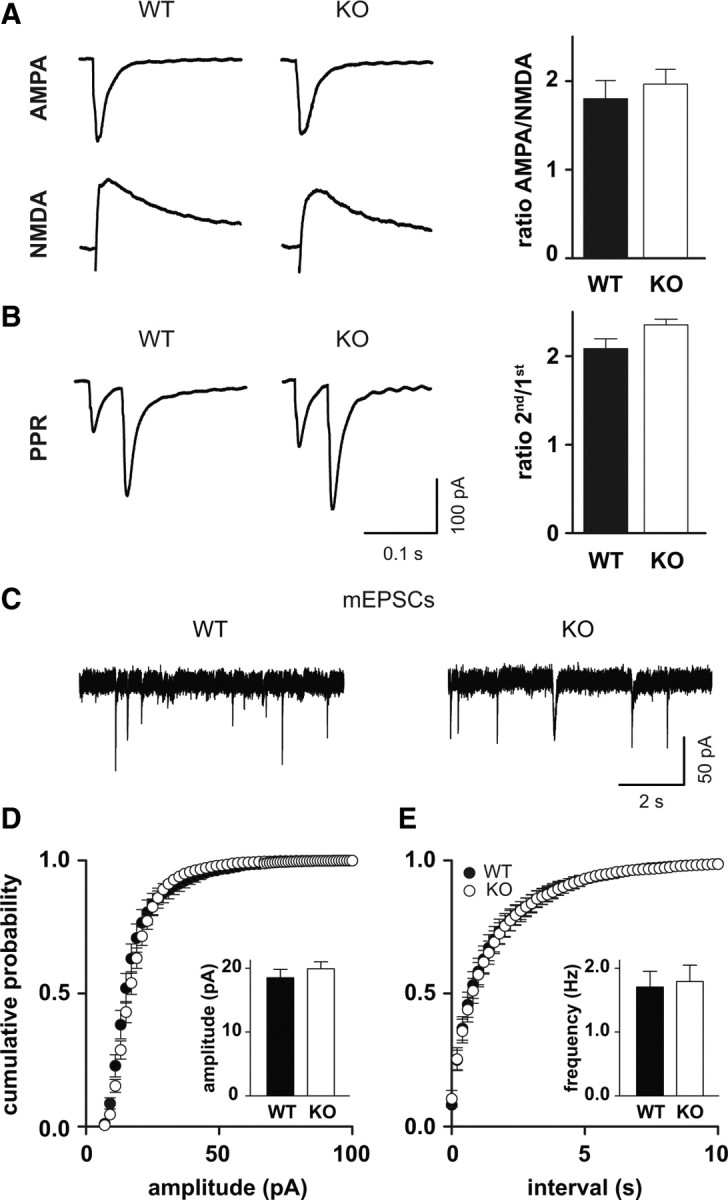
Excitatory synaptic transmission is not altered in Clcn2−/− mice. A, Ratio of AMPA to NMDA currents is not altered. Sample traces are shown at the left. AMPA currents were recorded at −70 mV, and NMDA currents were determined at +40 mV, 70 ms after the stimulus. B, PPR, a measure for presynaptic release, shows no difference between WT and KO. Sample traces are shown on the left. Stimulus artifacts have been omitted for clarity. Calibration is the same in A and B. C, Sample traces for mEPSC recordings for WT (left) and KO (right). D, Cumulative frequency distribution of mEPSC amplitudes (p = 1, Kolmogorov–Smirnov test; n = 18 for WT; n = 18 for KO). E, Cumulative frequency distribution of mEPSC frequencies (p = 1, Kolmogorov–Smirnov test; n = 18 for WT; n = 18 for KO). Error bars represent SEM in all graphs.