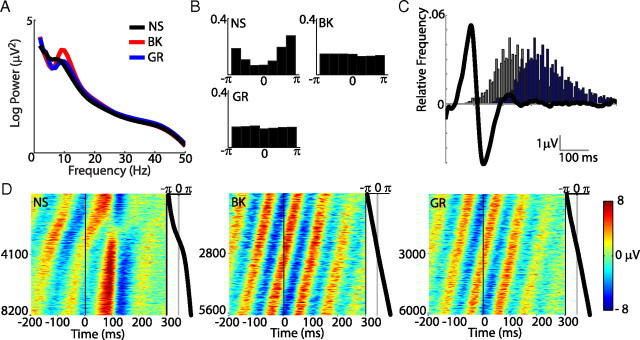
Figure 3.
Ongoing oscillatory state and EEG activity. A, Average power spectra of EEG activity between 0 and 200 ms after fixation onset for the three different image conditions. B, Distribution of instantaneous phase at fixation onset for NS (8 Hz), BK (10 Hz), and GR (10 Hz) epochs. C, Grand average fERP for the NS condition (black line), with histogram of the onset of the following fixation (gray bars), and histogram of expected P1 peak times for the following response, which is the gray distribution shifted 88 ms (blue bars). D, Stack plot of the complete NS (left), BK (middle), and GR (right) datasets, sorted by phase of the peak frequency (A) at fixation onset. At the right of each plot is the corresponding instantaneous fixation onset phase value (NS = 8 Hz; BK and GR = 10 Hz).

