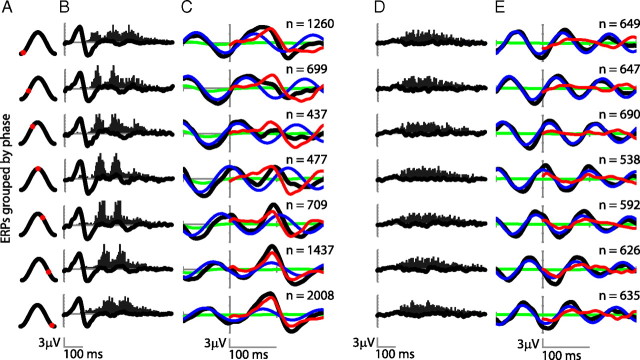
Figure 4.
fERP and analysis by phase groups. A, Data were categorized into seven phase bins centered at the value indicated by the red dot in the cosine waveform figure. B, fERP of the previous fixations and distribution of expected P1 peaks times according to fixation onset intervals. C, fERP of current fixation by phase groups (black line groups sorted accordingly to the phase at 8 Hz at fixation onset as in Fig. 3B). The blue lines correspond to the modeled ongoing oscillation with the same amplitude and phase of the activity previous to fixation onset. The red lines correspond to the difference between this oscillatory activity and actual data. Green lines represent a model where the fERP of previous fixations was repetitively aligned with the actual fixation onset and averaged for all fixations of the group. D, E, The same analysis as in B and C, respectively, for the GR condition. In this case, the phase groups are obtained accordingly to the phase at 10 Hz.

