Figure 3.
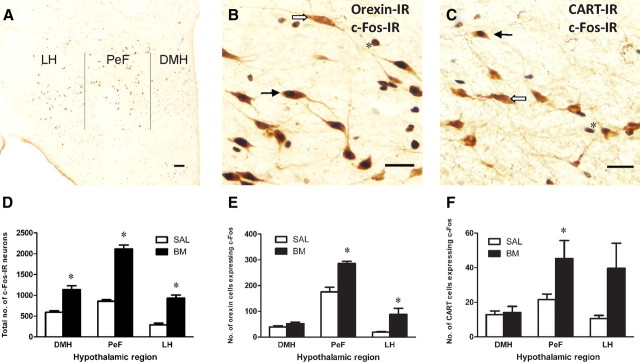
Dual-labeled c-Fos/orexin-IR and c-Fos/CART-IR cells were found in distinct regions of the hypothalamus. A, Photomicrograph of a representative coronal section through the hypothalamus indicating approximate boundaries used for cell counts. B, C, Photomicrographs of representative dual-labeled c-Fos/orexin-IR or c-Fos/CART-IR (black arrow), single-labeled orexin- or CART-IR (white arrow), and single-labeled Fos-IR (asterisk). D, Mean ± SEM number of total c-Fos-IR in each hypothalamic region. c-Fos-IR was significantly increased in all regions of the hypothalamus following B/M infusions into AcbSh. E, F, Mean ± SEM number of dual-labeled c-Fos/orexin-IR and c-Fos/CART-IR in each hypothalamic region. Following AcbSh infusions of B/M, dual-labeled c-Fos/orexin-IR cells increased significantly in PeF and LH while c-Fos/CART-IR increased significantly in PeF. *p < 0.05. Scale bars: A, B, 100 μm; C, 200 μm.

