
Figure 4.
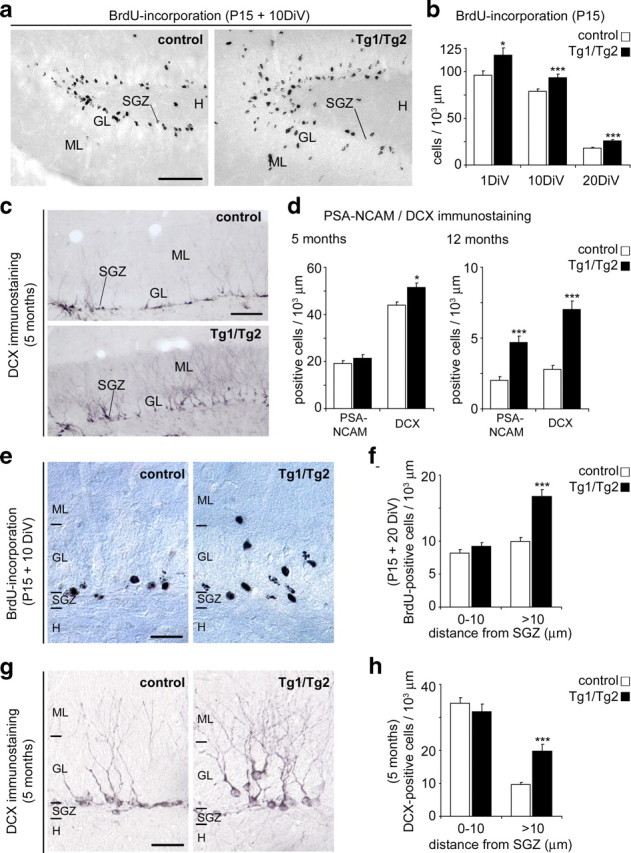
Neurogenesis and migration in the hippocampal SGZ. a, Sections from P25 aged mice immunostained with BrdU antibodies. Mice were injected with BrdU at P15. Control mice show most BrdU-positive cells near the SGZ layer; Tg1/Tg2 mice show a wider distribution of BrdU-positive cells in the GL. b, Densities of BrdU-positive cells in P15-old mice injected with BrdU pulses and killed after 24 h, 10 d, or 20 d. Note increased numbers of BrdU-labeled cells in Tg1/Tg2 mice. c, Low-power micrographs from control and Tg1/Tg2 hippocampal sections illustrating higher numbers of DCX-positive cells in the dentate gyrus of Tg1/Tg2 mice. d, Counts of PSA-NCAM- and DCX-positive neurons in the dentate gyrus of 5-month and 12-month-aged mice. e, g, Photomicrographs demonstrating the radial distribution of BrdU-positive cells and DCX-immunoreactive cells in control and Tg1/Tg2 mice; note the wider distribution of immunopositive neurons in Reelin-overexpressing mice. f, h, Histograms showing radial distribution of BrdU- and DCX-immunopositive neurons in the GL of control and Tg1/Tg2 mice. Notice that in Tg1/Tg2 mice, many neurons are not restricted to the inner GL. DiV, Days in vivo; H, hilus; ML, molecular layer; P15, postnatal day 15. Data are presented as mean ± SEM; *p < 0.05; ***p < 0.001; Student's t test. Scale bars: a, c, 100 μm; e, g, 50 μm.