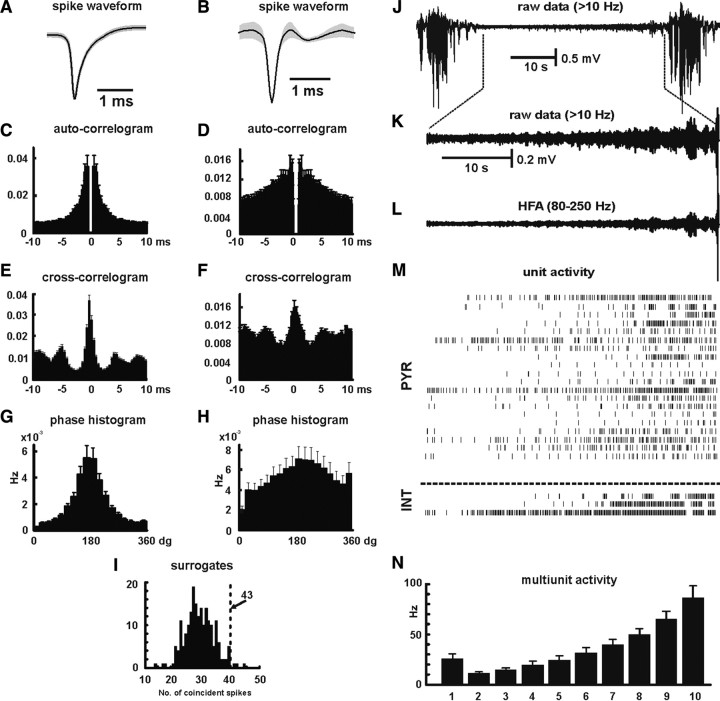
Figure 6.
Cellular mechanisms of HFA and dynamics of cellular firing. A, Averaged pyramidal cell action potential (gray area represents SEM; n = 84 cells). B, Averaged interneuronal action potential (gray area represents SEM; n = 27 cells). C, D, Normalized and averaged autocorrelograms of firing of pyramidal cells (C) and of interneurons (D). E, F, Averaged normalized cross-correlograms between HFA cycle and firing of pyramidal cells (E) and interneurons (F). G, Phase histograms of firing probability, during HFA cycles, show increase in probability of pyramidal cell firing during the HFA cycle, with increased probability of firing mainly during the trough of HFA cycle. H, Phase histogram for interneurons show only mild increase of firing during the HFA cycle. I, Coincident firing. Coincident firing was observed 43 times between the illustrated pair of neurons. Histogram shows the number (y-axis) of coincident firings (x-axis) observed in 200 surrogates. Results suggest that coincident firing between these two neurons is not attributable to random coincidence (p < 0.001). J–L, Interictal period between two seizures is characterized by a progressive buildup in HFA. M, Activity of pyramidal cells (PYR) and interneurons (INT) derived from three closely spaced tetrodes reveals a progressive increase in neuronal firing and recruitment of cells. N, Transition to seizures is characterized by progressive increase in multiunit activity (n = 24; 8 slices).

