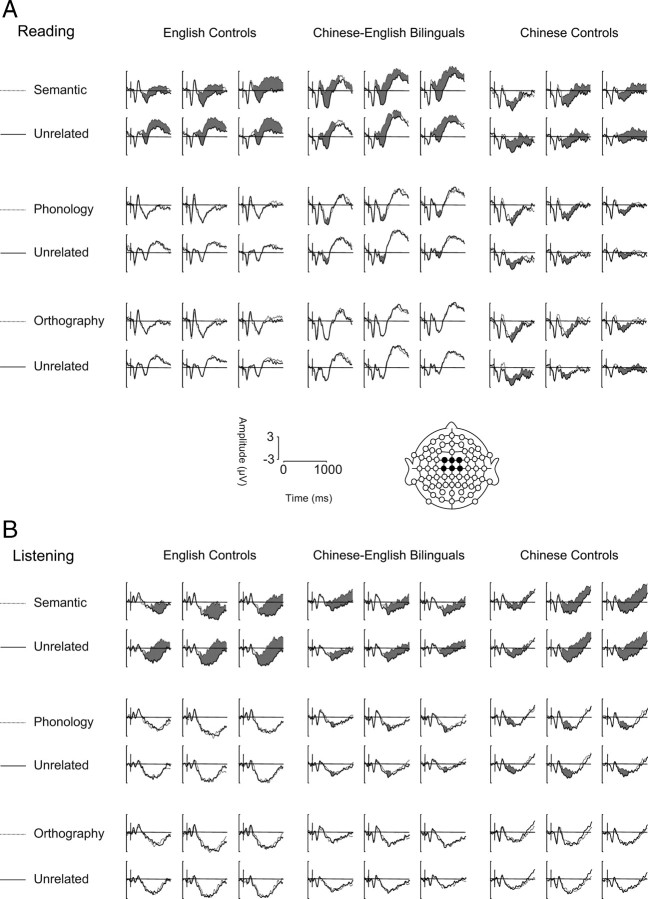
Figure 2.
ERP results for the English control group, the Chinese–English bilinguals, and the Chinese control group in reading (A) and listening (B) experiments. Waveforms depict brain potential variations from six electrodes (FC1, FC2, FCz, C1, C2, Cz). The schematic head shows electrode locations. The shaded areas represent significant differences between conditions (e.g., p < 0.05) over a minimal period of 30 ms.

