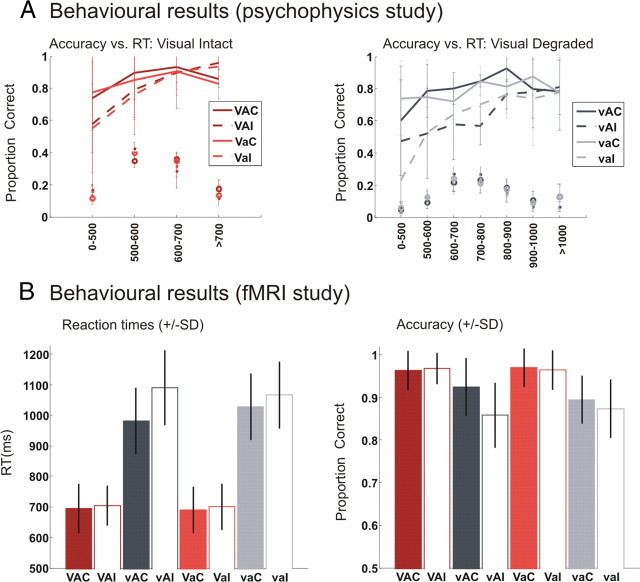
Figure 3.
Behavioral results. A, Psychophysics study outside the scanner: accuracy (across-subjects mean ± SD) as a function of reaction time bin is displayed for visual intact (left) and visual degraded (right) conditions. The dashed and solid lines denote the empirical probability of making a correct response as a function of binned RT; the markers (dots and circles) indicate the empirical distribution of response times over RT bins. The difference in the probability of correct responses between congruent (solid) and incongruent (dashed) conditions diverges for short response times. This profile is observed consistently for visual intact and degraded conditions, though the exact shape of the curves differ. Thus, as predicted by the compatibility bias model, the incongruency effect is most pronounced for trials with short response times. B, Behavioral performance during the fMRI study: response times (left) and accuracy (right) for the eight conditions (across-subjects means ± SD). V, Intact vision; v, degraded vision; A, intact audition; a, degraded audition; C, congruent; I, incongruent.

