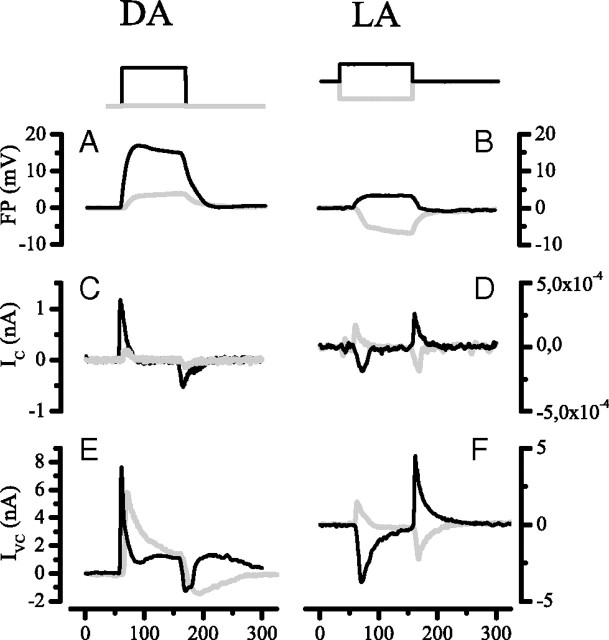
Figure 6.
A comparison between the properties of the FP and the voltage-clamped current in LMCs, IC, measured under dark-adapted (DA) and light-adapted (LA) conditions. The top traces show the step stimuli: DA, 102 photons/s (gray), and 106 photons/s (black); LA, contrasts ±1.0 (positive, black; negative, gray) applied against a background of 106 photons/s. A, Dark-adapted FP responses to large (black) and small (gray) step stimuli. B, Light-adapted FP responses to positive (black) and negative (gray) contrasts. C, D, The first derivatives (dV/dt) of the FP; trace color (black or gray) indicates stimulus as above. These plots indicate the time courses of the currents required to create the corresponding FPs, were they membrane potentials. Note that the currents are plotted in arbitrary units. E, F, Voltage-clamp currents recorded from LMCs under the same conditions as the FPs; trace colors (black or gray) are indicated as above. LMCs were clamped at the dark resting potential. Note the similarity between the dV/dt curves (C, D) and the LMC currents.

