
Figure 2.
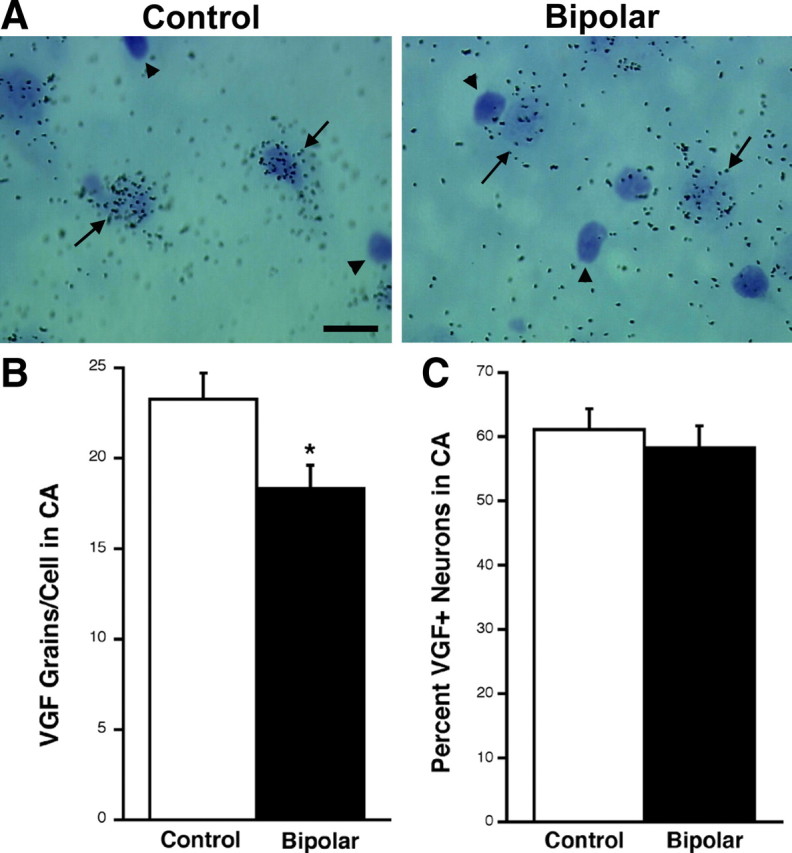
Bipolar samples have a reduction in the levels of VGF mRNA per CA pyramidal neuron but not in the number of cells expressing VGF. A, Bright-field photomicrograph (100×) demonstrating VGF mRNA hybridization signal in the CA region of the human hippocampus. Black arrows indicate pyramidal cells that are more strongly labeled in control patients than in bipolar disorder. Arrowheads indicate cells darkly stained with cresyl violet that do not express VGF mRNA. Scale bar, 50 μm. B, Bar graph of the average ± SEM number of silver grains per VGF mRNA-positive CA pyramidal neuron in control and bipolar patients (*t (26) = 2.54, p = 0.0173). C, Bar graph of the mean ± SEM percentage of neurons positive for VGF mRNA in CA pyramidal cells of control and bipolar disorder patients. There is no significant change detected (t (26) = 0.613, p = 0.5449). Fifty cells were counted per sample (n = 14).