
Figure 4.
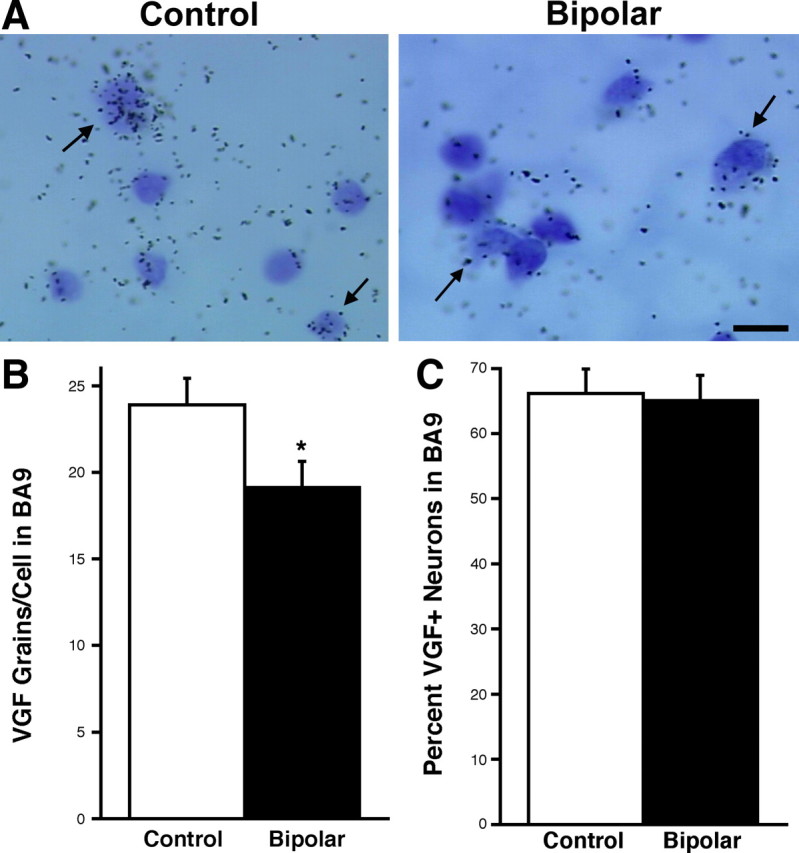
Silver grain analysis in BA9 reveals less VGF mRNA per cell but no change in the number of VGF-positive neurons. A, Bright-field photomicrograph (100×) demonstrating VGF mRNA hybridization signal in layer VI of BA9. Black arrows indicate the polymorphic layer cells that are more strongly labeled in control patients than in bipolar disorder patients. Scale bar, 25 μm. B, Bar graph of the average ± SEM number of silver grains per VGF mRNA-positive layer VI neurons in control and bipolar patients (*t (28) = 2.216, p = 0.0350). C, Bar graph of the mean ± SEM percentage of neurons positive for VGF mRNA in layer VI cells of control and bipolar patients. There is no significant change detected (t (28) = 0.198, p = 0.8445). Fifty cells were counted per sample (n = 15).